

Question: Data Analysis in R language Do a log transformation on the house prices. Create a new variable that represents the natural log of the selling
Data Analysis in R language
Do a log transformation on the house prices. Create a new variable that represents the natural log of the selling price.
Perform a two-way analysis of variance with the log of the price as the response variable, and region plus multiple bathrooms.
Report the ANOVA table and coefficient estimates. Interpret the following:
P-values for the main and interaction effects.
Coefficient estimates that are statistically significant.
The value of the adjusted R-squared.
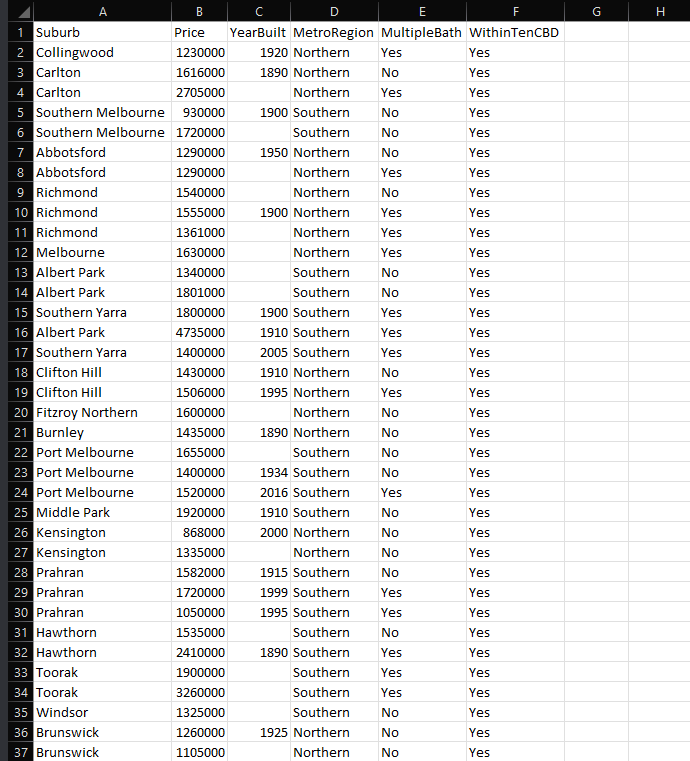
The data looks like this:
Step by Step Solution
There are 3 Steps involved in it
1 Expert Approved Answer
Step: 1 Unlock

Question Has Been Solved by an Expert!
Get step-by-step solutions from verified subject matter experts
Step: 2 Unlock
Step: 3 Unlock