

Question: data analytics 8 A B C D EmployeeID UsageRate Recognition Leader 1 0% 0 0 2 63% 0 0 3 0% 0 0 4 0%
data analytics 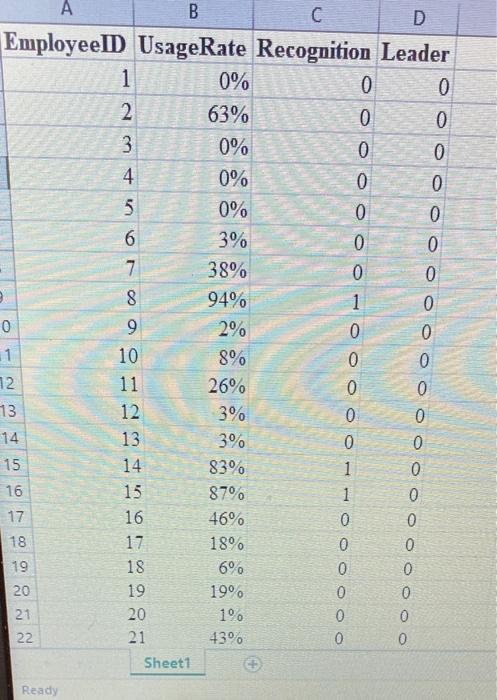
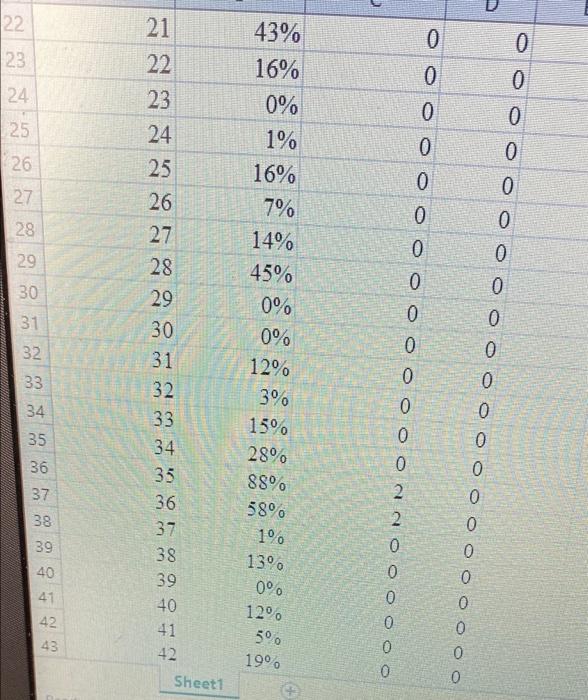
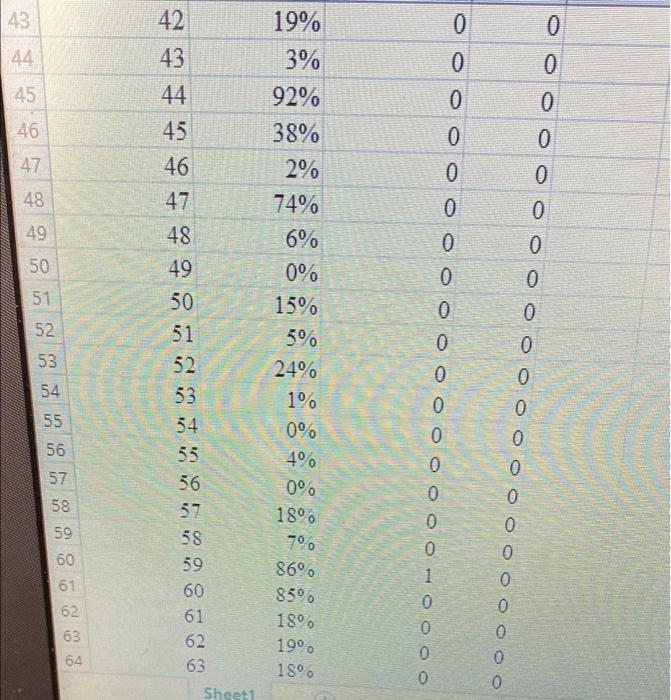
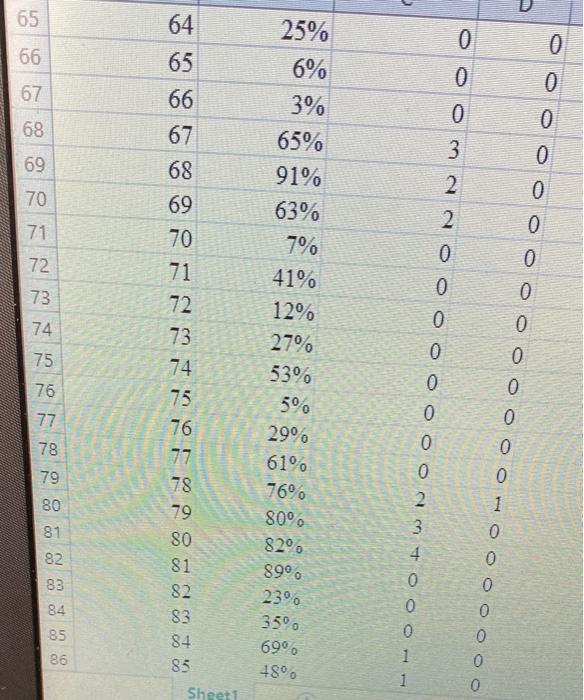
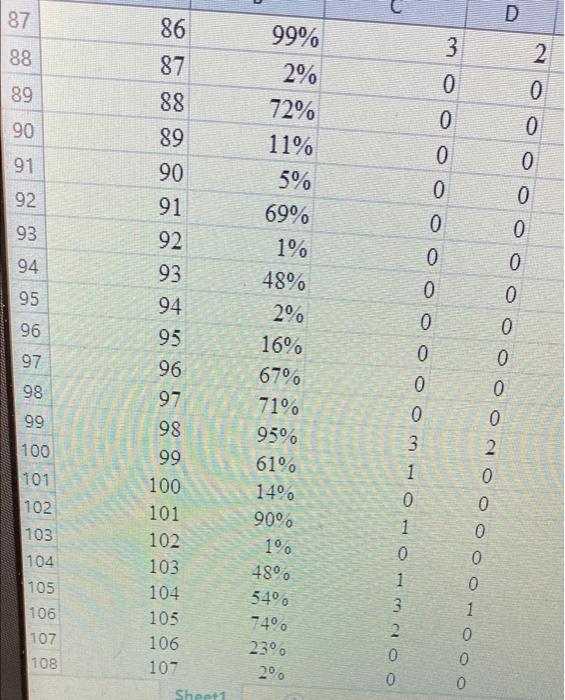
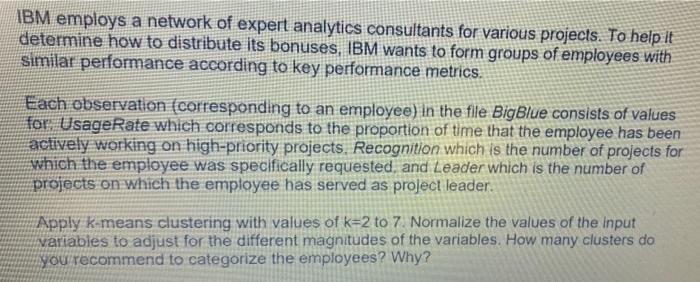
8 A B C D EmployeeID UsageRate Recognition Leader 1 0% 0 0 2 63% 0 0 3 0% 0 0 4 0% 0 0 5 0% 0 0 6 3% 0 0 7 38% 0 0 94% 0 9 2% 0 0 11 10 8% 0 0 72 11 26% 0 0 73 12 3% 0 14 13 3% 0 0 15 14 83% 1 16 15 87% 1 0 17 16 46% 0 0 18 17 18% 0 0 19 18 6% 0 0 20 19 199 0 0 21 20 19 0 0 22 21 43 0 0 Sheet1 OOO 0 4 Ooo Ready 2 22. 0 0 23 0 0 | 24 0 | 25 126 0 0 0 0 0 27 0 0 28 29 0 0 30 0 0 0 0 31 0 32 21 43% 22 16% 23 0% 24 1% 25 16% 26 7% 27 14% 28 45% 29 0% 30 0% 31 12% 32 3% 33 15% 34 28% 35 88% 36 58% 37 1% 38 13% 0 40 12 41 50 199 Sheet1 0 0 0 3 33 0 34 0 35 + 36 2 37 38 0 0 0 0 0 0 0 39 OO LOO O OOO 40 41 39 4 42 0 0 43 42 OO 43 0 0 44 0 0 45 0 0 46 0 0 47 0 0 48 0 0 49 0 0 50 0 51 0 0 0 0 52 D 0 42 19% 43 3% 44 92% 45 38% 46 2% 47 74% 48 6% 49 0% 50 15% 51 5% 52 24% 53 1% 54 0 4 56 0% 57 1896 58 700 59 86% 60 85 61 18% 62 19 63 18 Sheet1 53 0 54 0 0 0 55 0 56 3 57 58 59 0 0 1 0 0 0 0 0 0 60 61 62 63 0 0 0 0 0 64 0 0 65 0 66 0 0 0 67 0 0 68 0 69 64 65 66 67 68 69 70 71 72 73 74 70 3 2 2 0 0 0 0 71 0 0 72 0 73 0 0 74 0 25% 6% 3% 65% 91% 63% 7% 41% 12% 27% 53% 5% 29% 61% 76 80% 820 890 23 35 690 48 75 0 0 0 76 0 au + 0 77 78 0 0 0 79 Sonjavi 1 80 81 OO O O OO 82 79 80 81 82 83 84 85 83 0 0 0 84 85 86 0 0 0 Sheet1 87 88 2 3 0 89 0 90 0 0 0 0 91 0 92 0 0 93 0 94 0 0 0 95 0 0 96 0 86 87 88 89 90 91 92 93 94 95 96 97 98 99 100 101 102 103 104 105 106 107 99% 2% 72% 11% 5% 69% 1% 48% 2% 16% 67% 71% 95% 61% 14 90 1% 48 54% 74% 23 20 97 9 0 0 0 0 98 0 99 100 3 2 101 OOOO 0 102 103 104 OODUS OOS 0 0 3. 105 106 107 1 0 108 Sheet1 IBM employs a network of expert analytics consultants for various projects. To help it determine how to distribute its bonuses, IBM wants to form groups of employees with similar performance according to key performance metrics. Each observation (corresponding to an employee) in the file BigBlue consists of values for UsageRate which corresponds to the proportion of time that the employee has been actively working on high-priority projects. Recognition which is the number of projects for which the employee was specifically requested and Leader which is the number of projects on which the employee has served as project leader. Apply k-means clustering with values of k=2 to 7 Normalize the values of the input variables to adjust for the different magnitudes of the variables. How many clusters do you recommend to categorize the employees? Why Step by Step Solution
There are 3 Steps involved in it
1 Expert Approved Answer
Step: 1 Unlock

Question Has Been Solved by an Expert!
Get step-by-step solutions from verified subject matter experts
Step: 2 Unlock
Step: 3 Unlock