

Question: Data Analytics and Modeling QUESTION 1 Over the past year or so, the grade distribution for my class looks like the following Grade Prob A
Data Analytics and Modeling
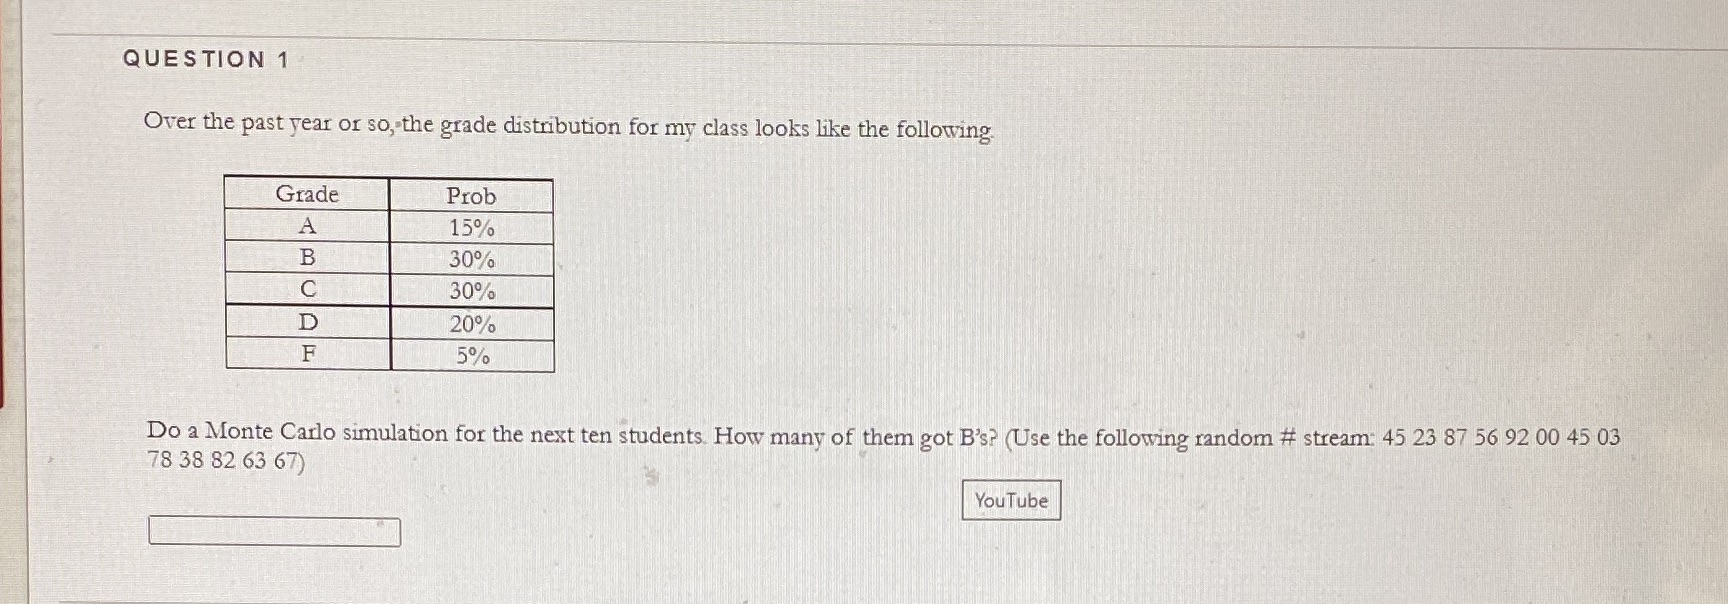
QUESTION 1 Over the past year or so, the grade distribution for my class looks like the following Grade Prob A 15% B 30% C 30% D 20% 5% Do a Monte Carlo simulation for the next ten students. How many of them got B's? (Use the following random # stream: 45 23 87 56 92 00 45 03 78 38 82 63 67) You Tube
Step by Step Solution
There are 3 Steps involved in it
1 Expert Approved Answer
Step: 1 Unlock

Question Has Been Solved by an Expert!
Get step-by-step solutions from verified subject matter experts
Step: 2 Unlock
Step: 3 Unlock