

Question: Data Analytics at HydroHappy Excel DA9.1 Data visualization can be used to analyze trends in production levels. HydroHappy has developed a new marketing plan
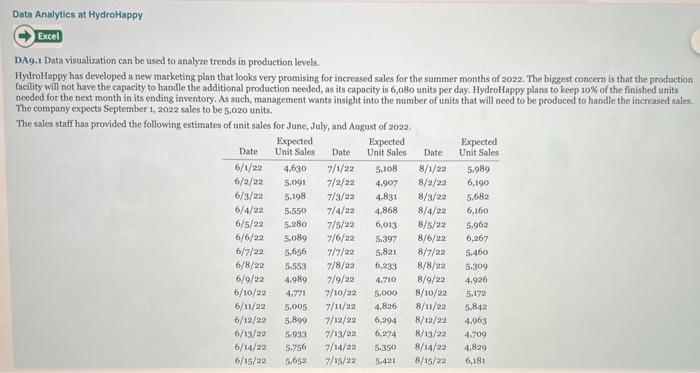
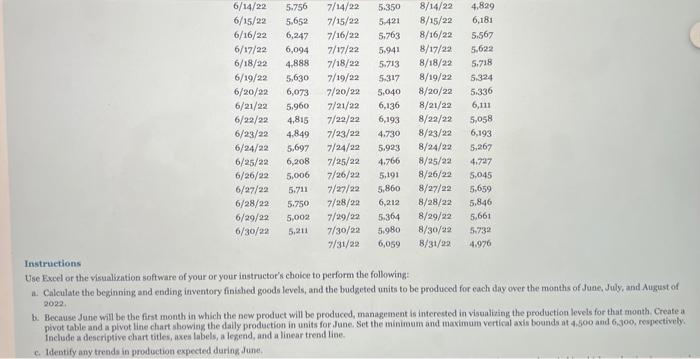
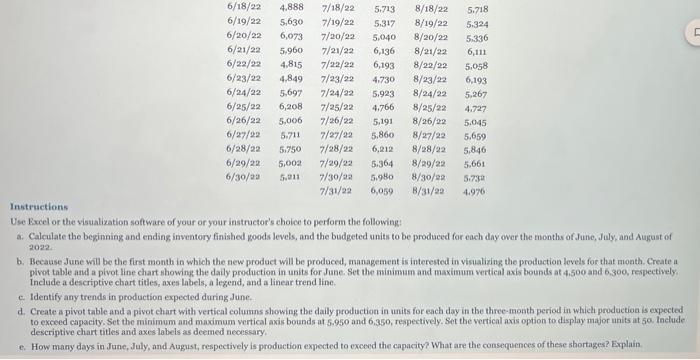
Data Analytics at HydroHappy Excel DA9.1 Data visualization can be used to analyze trends in production levels. HydroHappy has developed a new marketing plan that looks very promising for increased sales for the summer months of 2022. The biggest concern is that the production facility will not have the capacity to handle the additional production needed, as its capacity is 6,080 units per day. HydroHappy plans to keep 10% of the finished units needed for the next month in its ending inventory. As such, management wants insight into the number of units that will need to be produced to handle the increased sales. The company expects September 1, 2022 sales to be 5,020 units. The sales staff has provided the following estimates of unit sales for June, July, and August of 2022. Date Expected Unit Sales Date Expected Unit Sales Expected Date Unit Sales 6/1/22 4.630 7/1/22 5,108 8/1/22 5.989 6/2/22 5,091 7/2/22 4.907 8/2/22 6,190 6/3/22 5.198 7/3/22 4.8311 8/3/22 5,682 6/4/22 5.550 7/4/22 4.868 8/4/22 6,160 6/5/22 5,280 7/5/22 6,013 8/5/22 5.962 6/6/22 5,089 7/6/22 6/7/22 5.656 7/7/22 6/8/22 5.553 7/8/22 6/9/22 4.989 7/9/22 6/10/22 4.771 7/10/22 6/11/22 5,005 7/11/22 4,826 6/12/22 5,899 7/12/22 6,294 6/13/22 5.933 7/13/22 6,274 6/14/22 5.756 7/14/22 5.350 6/15/22 5.652 7/15/22 5,421 5.397 8/6/22 6,267 5,821 8/7/22 5,460 6,233 8/8/22 5.309 4.710 8/9/22 4.926 5,000 8/10/221 5,172 8/11/22 5,842 8/12/22 4.963 8/13/22 4.709 8/14/22 4.829 8/15/22 6,181
Step by Step Solution
There are 3 Steps involved in it

Get step-by-step solutions from verified subject matter experts