

Question: Data Analytics / Financial Ratio Analysis This assignment will focus on the comparison between T Mobile and Verizon. Identify each companys weak and/or strong areas
Data Analytics / Financial Ratio Analysis
This assignment will focus on the comparison between T Mobile and Verizon. Identify each companys weak and/or strong areas of performance. After analysis, if you had $1,000 to purchase stock in either of these companies, which would you choose? Calculate the following in this workbook for both T Mobile and Verizon from the most recent 2 years. Complete the vertical analysis in the statements worksheet. Complete the ratio analysis in the analysis worksheet.
1. Vertical Analysis of both the income statement (three years) and balance sheet (two years). Use the yellow highlighted columns for your vertical analysis. 2. Current ratio - this examines a company's liquidity 3. Debt ratio (Total Liabilities / Total Assets) - This examines the capital structure of a company 4. Total asset turnover ratio - This examines a company's efficiency 5. Net profit margin (net income / net revenue) - This is a profitability ratio 6. Return on Equity - This is also a profitability ratio Upon completion of the above, in which company would you invest your $1,000? Why? Use your analysis to support your choice.
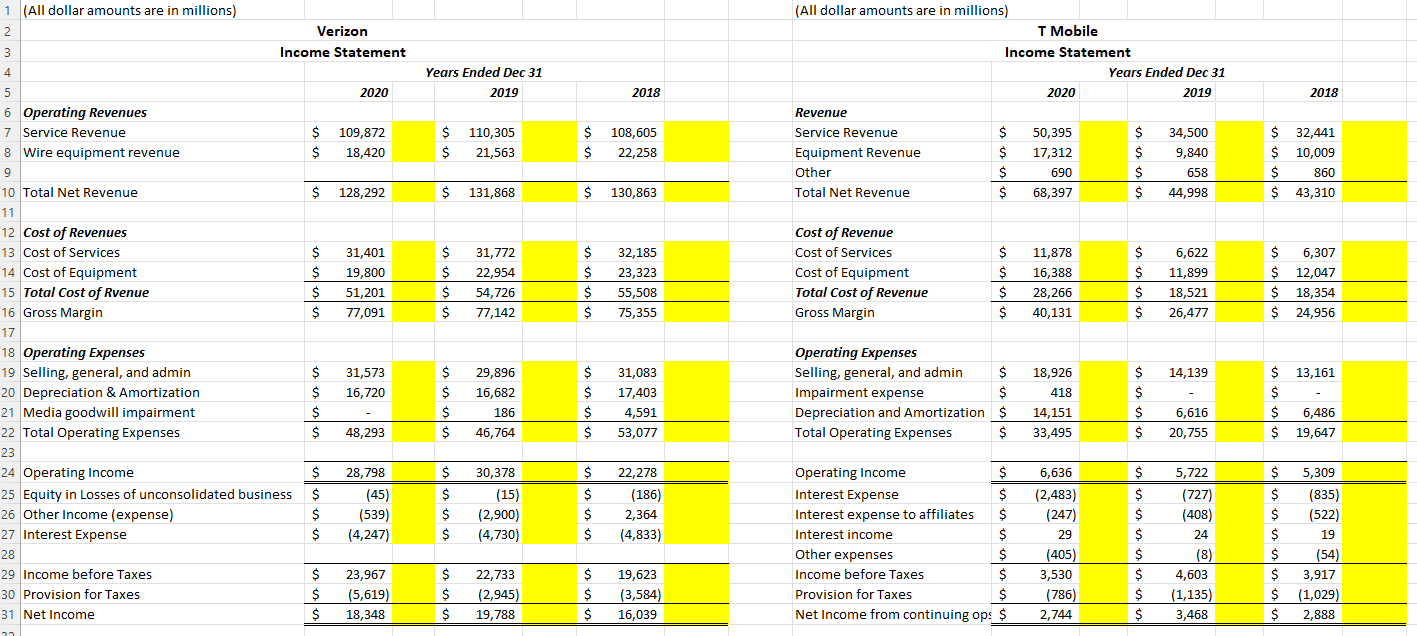
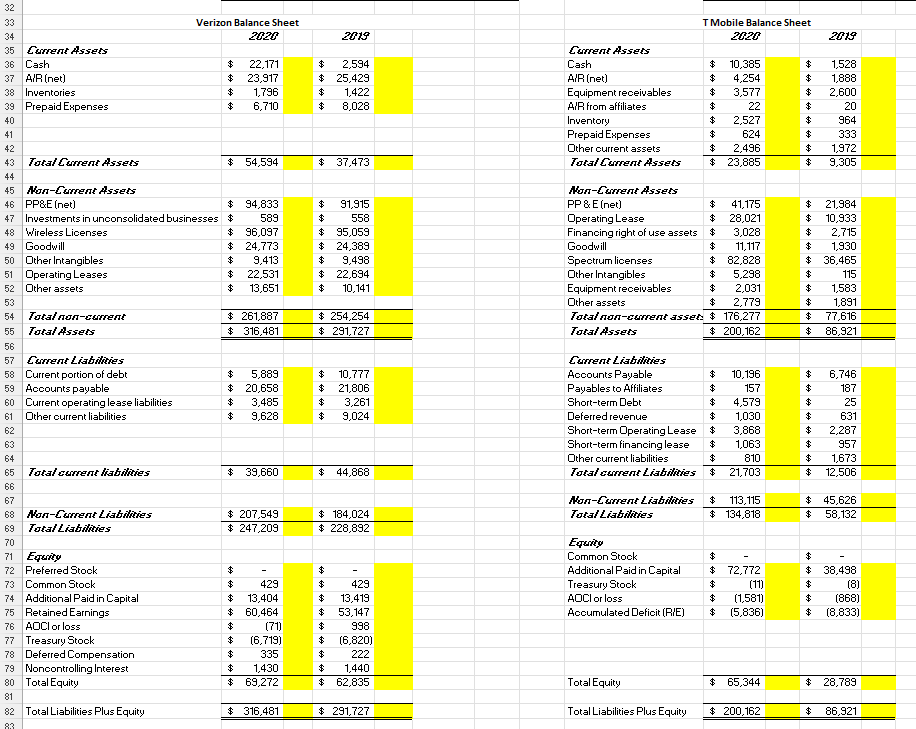
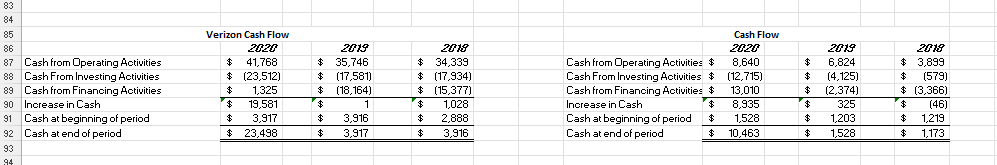
1 (All dollar amounts are in millions) 2 Verizon 3 Income Statement 4 5 2020 6 Operating Revenues 7 Service Revenue $ 109,872 $ 18,420 8 Wire equipment revenue 9 10 Total Net Revenue $ 128,292 11 12 Cost of Revenues 13 Cost of Services $ 14 Cost of Equipment $ 31,401 19,800 51,201 77,091 15 Total Cost of Rvenue $ 16 Gross Margin $ 17 18 Operating Expenses 19 Selling, general, and admin $ 31,573 16,720 20 Depreciation & Amortization $ 21 Media goodwill impairment $ 22 Total Operating Expenses $ 48,293 23 24 Operating Income $ 25 Equity in Losses of unconsolidated business $ 28,798 (45) (539) (4,247) 26 Other Income (expense) $ 27 Interest Expense $ 28 29 Income before Taxes $ 30 Provision for Taxes $ 23,967 (5,619) 18,348 31 Net Income $ 32 Years Ended Dec 31 2019 $ 110,305 $ 21,563 $ 131,868 $ 31,772 $ 22,954 $ 54,726 $ 77,142 $ $ 29,896 16,682 186 46,764 $ $ $ 30,378 (15) $ $ (2,900) $ (4,730) $ $ 22,733 (2,945) $ 19,788 2018 $ $ 108,605 22,258 $ 130,863 $ 32,185 23,323 $ $ 55,508 $ 75,355 $ $ $ 31,083 17,403 4,591 53,077 $ $ 22,278 $ (186) $ 2,364 $ (4,833) $ 19,623 $ (3,584) $ 16,039 (All dollar amounts are in millions) T Mobile Income Statement 2020 Revenue Service Revenue Equipment Revenue Other $ 50,395 $ 17,312 $ 690 68,397 Total Net Revenue $ Cost of Revenue Cost of Services Cost of Equipment $ $ $ 11,878 16,388 28,266 40,131 Total Cost of Revenue Gross Margin $ Operating Expenses Selling, general, and admin Impairment expense $ $ $ $ 18,926 418 14,151 33,495 Depreciation and Amortization Total Operating Expenses Operating Income $ Interest Expense $ Interest expense to affiliates $ 6,636 (2,483) (247) 29 (405) Interest income $ Other expenses $ $ Income before Taxes Provision for Taxes $ 3,530 (786) 2,744 Net Income from continuing ops $ Years Ended Dec 31 2019 $ $ $ $ 44,998 34,500 9,840 658 $ 6,622 $ 11,899 $ 18,521 $ 26,477 14,139 $ $ $ $ 6,616 20,755 $ $ $ $ $ $ $ $ 5,722 (727) (408) 24 (8) 4,603 (1,135) 3,468 2018 $ 32,441 $ 10,009 $ 860 $ 43,310 $ 6,307 $ 12,047 $ 18,354 $ 24,956 $ 13,161 $ $ 6,486 $ 19,647 $ $ $ $ 5,309 (835) (522) 19 (54) 3,917 $ (1,029) $ 2,888 $ $ 32 33 Verizon Balance Sheet 2020 34 35 Current Assets 36 Cash $ 37 A/R (net) $ 22,171 23,917 1,796 6,710 38 Inventories $ 39 Prepaid Expenses $ 40 41 42 43 Total Current Assets $ 54,594 44 45 Non-Current Assets 46 PP&E (net) $ 47 Investments in unconsolidated businesses $ 48 Wireless Licenses $ 94,833 589 96,097 24,773 9,413 22,531 49 Goodwill $ 50 Other Intangibles $ 51 Operating Leases $ 52 Other assets $ 13,651 53 54 Total non-current $261,887 $316,481 55 Total Assets 56 57 Current Liabilities 58 Current portion of debt $ 5,889 $ 20,658 59 Accounts payable 60 Current operating lease liabilities $ 3,485 61 Other current liabilities $ 9,628 62 63 64 65 Total curent liabilities $ 39,660 66 67 68 Non-Current Liabilities $ 207,549 69 Total Liabilities $ 247,209 70 71 Equity 72 Preferred Stock $ 73 Common Stock 429 74 Additional Paid in Capital $ 13,404 75 Retained Earnings $ 76 AOCI or loss $ 77 Treasury Stook $ 60,464 (71) (6,719) 335 1,430 78 Deferred Compensation $ 79 Noncontrolling Interest $ 80 Total Equity $ 69,272 81 82 Total Liabilities Plus Equity $316,481 83 2019 $ 2,594 $ 25,429 $ 1,422 $ 8,028 $ 37,473 $ 91,915 558 $ 95,059 $ 24,389 $ 9,498 $ 22,694 $ 10,141 $ 254,254 $ 291,727 $ 10,777 $ 21,806 $ 3,261 $ 9,024 $ 44,868 $184,024 $ 228,892 $ $ 429 $ 13,419 $53,147 $ 998 $ (6,820) 222 $ $ 1,440 $ 62,835 $ 291,727 T Mobile Balance Sheet 2020 Current Assets Cash 10,385 $ $ $ $ A/R (net) Equipment receivables $ $ A/R from affiliates Inventory 4,254 3,577 22 2,527 624 $ 2,496 $ 23,885 $ $ $ Prepaid Expenses Other current assets $ $ Total Current Assets Non-Current Assets PP & E (net) $ Operating Lease Financing right of use assets Goodwill 41,175 28,021 $ 3,028 $ 11,117 $82,828 $ 5,298 $ 2,031 $ 2,779 Spectrum licenses Other Intangibles Equipment receivables Other assets Total non-current asset: $ 176,277 Total Assets $ 200,162 Current Liabilities Accounts Payable Payables to Affiliates $ 10,196 $ Short-term Debt Deferred revenue Short-term Operating Lease Short-term financing lease Other current liabilities Total current Liabilities 157 4,579 $ 1,030 $ 3,868 $ 1,063 $ 810 $ 21,703 Non-Current Liabilities Total Liabilities $ 113,115 $ 134,818 Equity Common Stock Additional Paid in Capital Treasury Stock $ $ 72,772 (11) (1,581) (5,836) $ $ $ AOCI or loss Accumulated Deficit (R/E) Total Equity $ 65,344 Total Liabilities Plus Equity $ 200,162 2019 1,528 1,888 2,600 20 964 333 1,972 9,305 $ 21,984 10,933 2,715 $ 1,930 $36,465 $ 115 1,583 1,891 77,616 $ $ $ 86,921 $ 6,746 187 25 631 $ $ 2,287 $ $ 957 1,673 12,506 $ 45,626 $ 58,132 $ $38,498 (8) $ (868) (8,833) $ 28,789 $ 86,921 83 84 85 86 87 Cash from Operating Activities 88 Cash From Investing Activities 89 Cash from Financing Activities 90 Increase in Cash 91 Cash at beginning of period 92 Cash at end of period 93 94 Verizon Cash Flow 2020 $ 41,768 $ (23,512) $ $ 1,325 19,581 3,917 $ $ 23,498 2019 $ 35,746 $ (17,581) $(18,164) $ 1 3,916 3,917 $ 2018 $ 34,339 $(17.934) $ (15,377) $ 1,028 $ 2,888 $ 3,916 Cash Flow 2020 Cash from Operating Activities $ 8.640 Cash From Investing Activities $ (12,715) Cash from Financing Activities $ 13,010 Increase in Cash $ 8,935 Cash at beginning of period $ 1,528 Cash at end of period $ 10,463 2019 $ $ $ 6,824 (4,125) (2,374) $ 325 1,203 1,528 $ -- DEON 2018 $ 3,899 (579) $ (3,366) $ (46) $ 1,219 $ 1,173
Step by Step Solution
There are 3 Steps involved in it

Get step-by-step solutions from verified subject matter experts