Question: Data Analytics for Management (MGMT-540-9) Turnitin: This assignment will be submitted to Turnitin. Instructions: Please follow the instructions in Final -2025 attached. Use the Final
Data Analytics for Management (MGMT-540-9)
Turnitin:
This assignment will be submitted to Turnitin.
Instructions: Please follow the instructions in Final -2025 attached. Use the Final Excel Template for submitting your assignment.
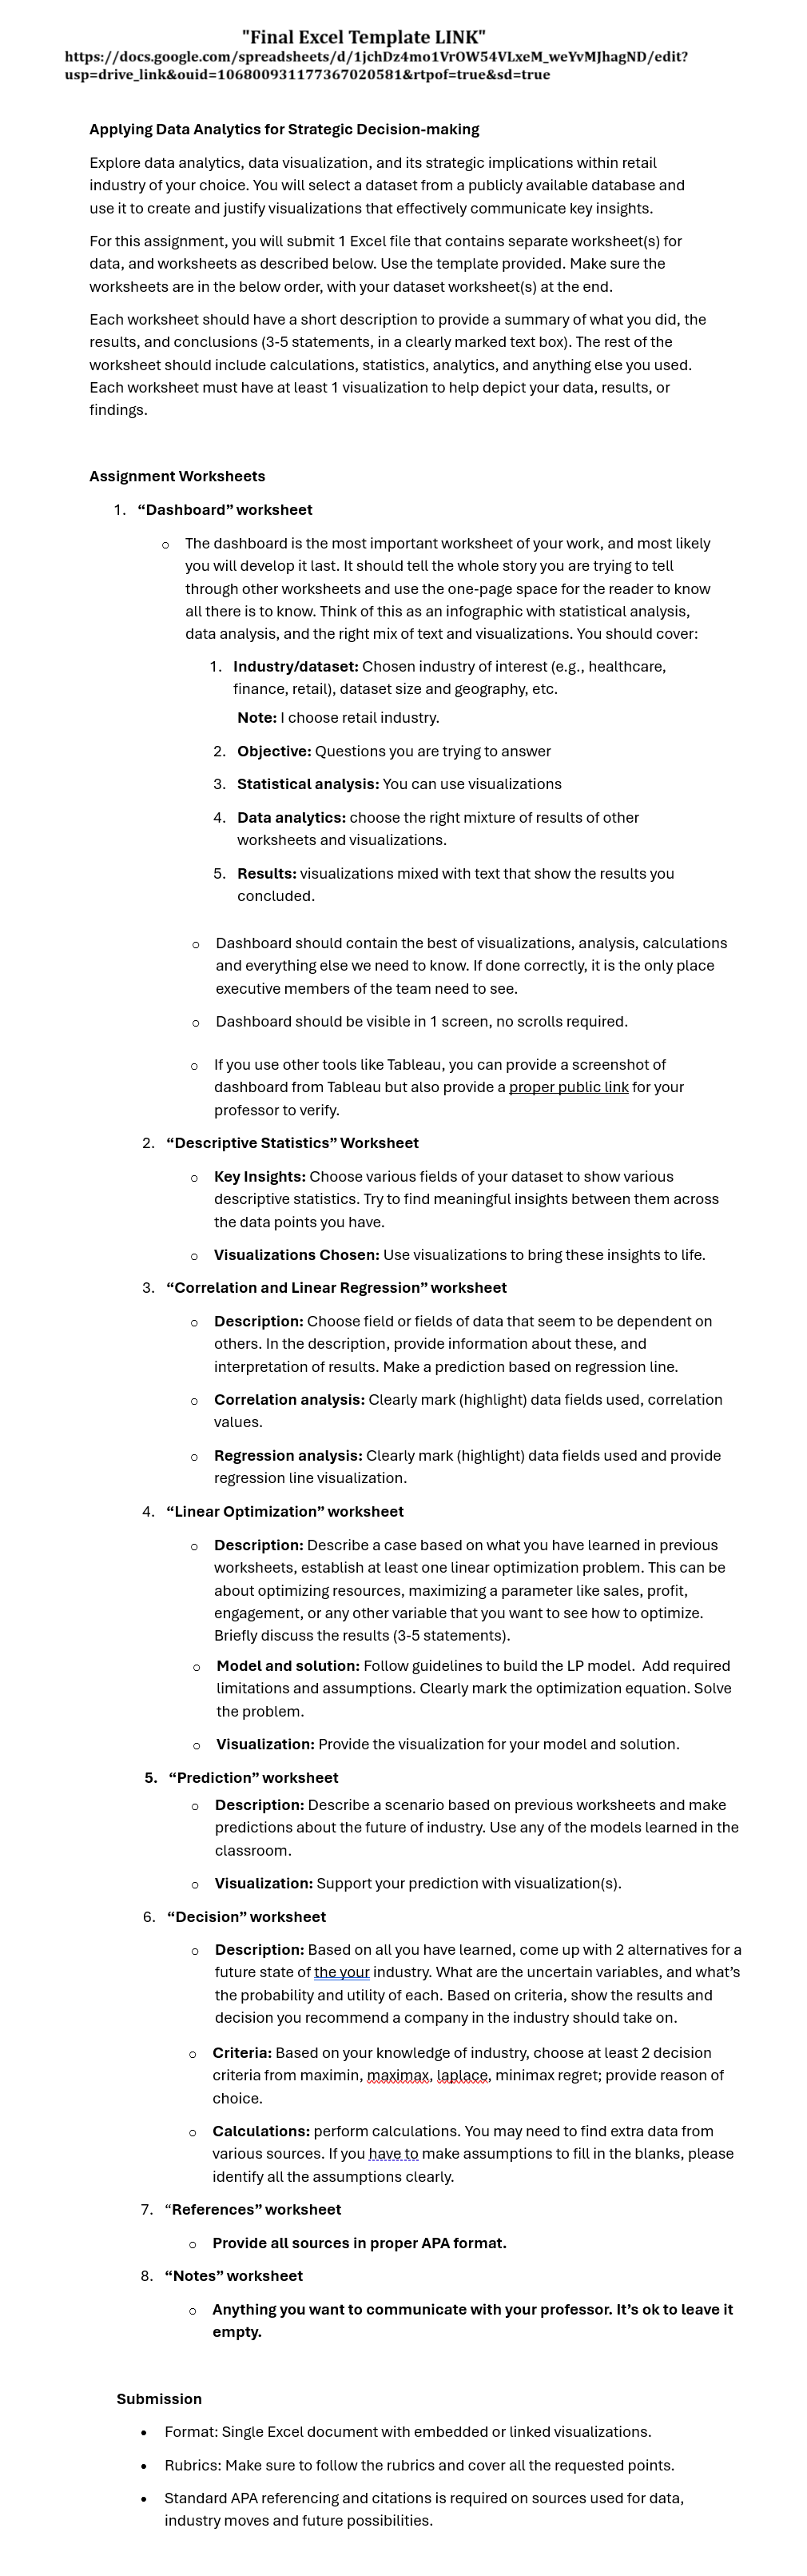
Final Excel Template LINK: https://docs.google.com/spreadsheets/d/1jchDz4mo1VrOW54VLxeM_weYvMJhagND/edit?usp=drive_link&ouid=106800931177367020581&rtpof=true&sd=true
Applying Data Analytics for Strategic Decision-making Explore data analytics, data visualization, and its strategic implications within an industry of your choice. You will select a dataset from a publicly available database and use it to create and justify visualizations that effectively communicate key insights.
For this assignment, you will submit 1 Excel file that contains separate worksheet(s) for data, and worksheets as described below. Use the template provided. Make sure the worksheets are in the below order, with you dataset worksheet(s) at the end.
Each worksheet should have a short description to provide a summary of what you did, the results, and conclusions (3-5 statements, in a clearly marked text box). The rest of the worksheet should include calculations, statistics, analytics, and anything else you used. Each worksheet must have at least 1 visualization to help depict your data, results, or findings.
Use verifiable recent dataset for retail industry/sector and provide the link to it.
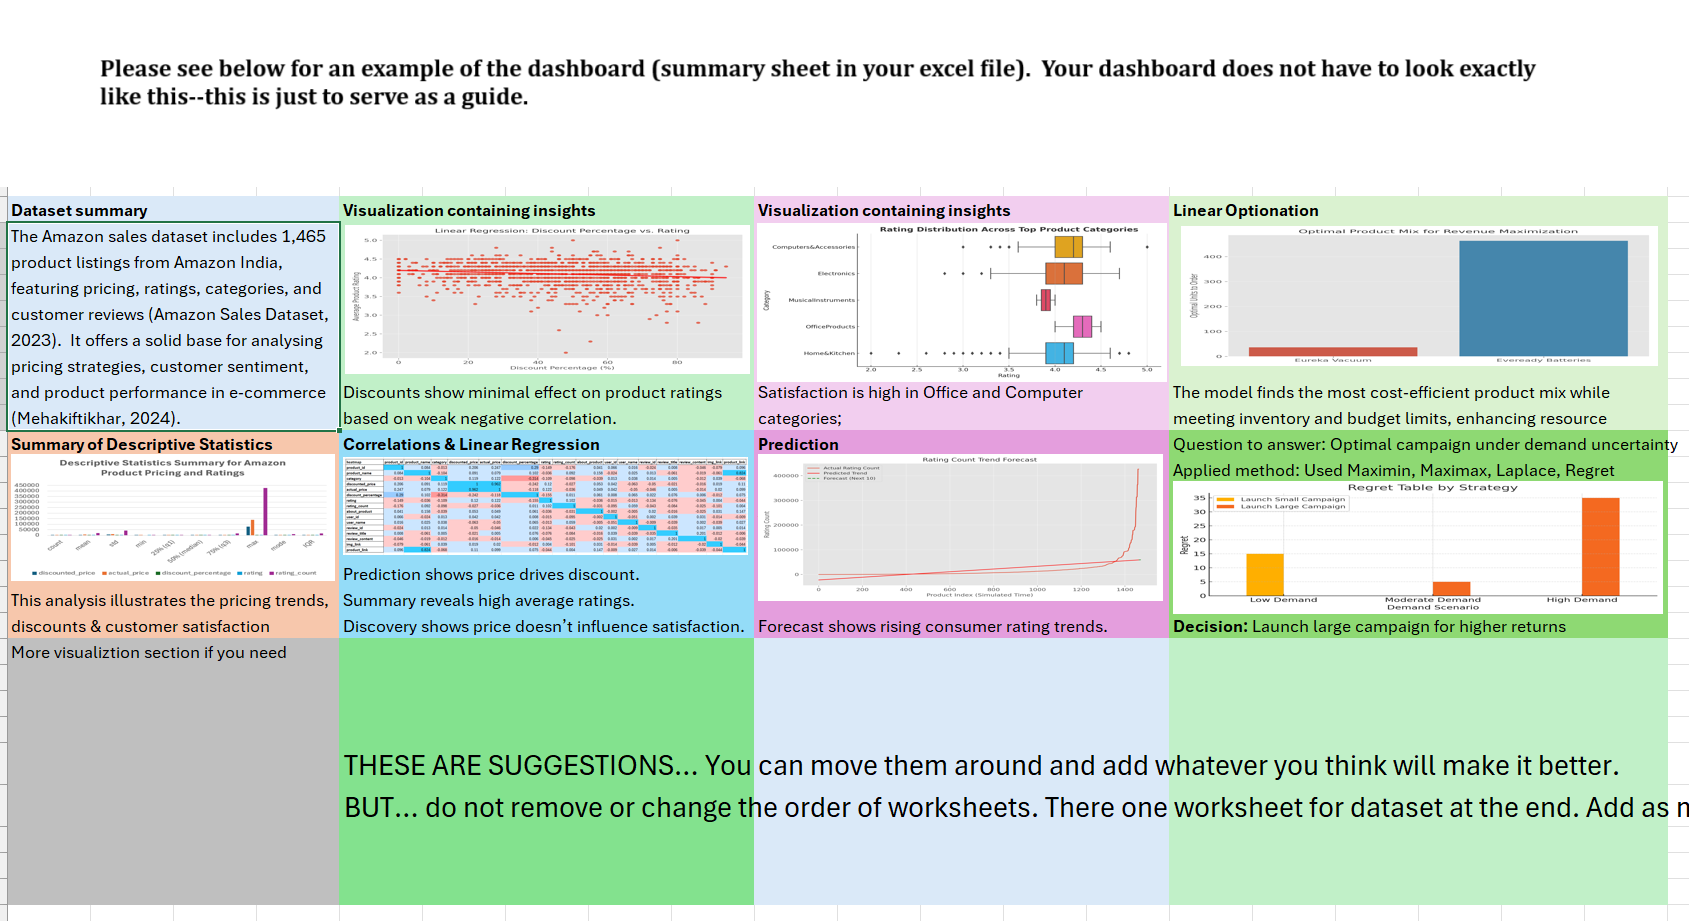
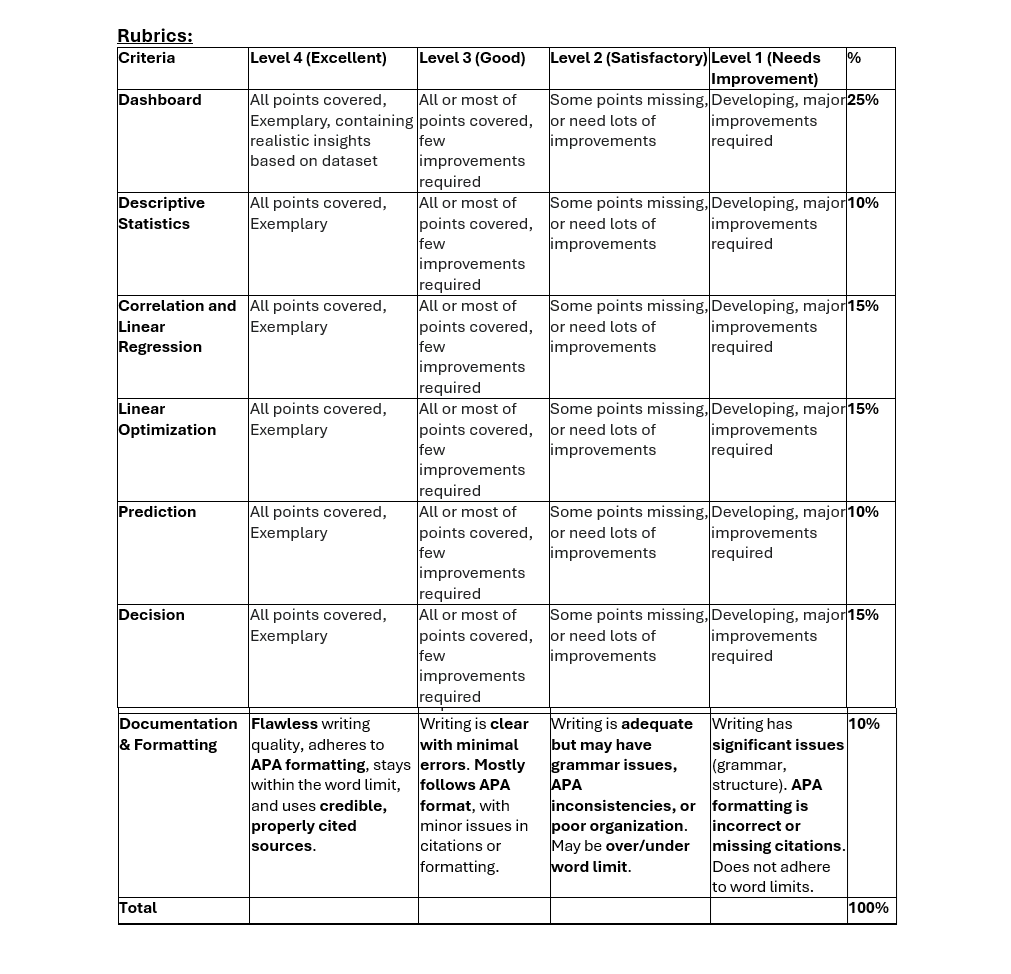
Please see below for an example of the dashboard (summary sheet in your excel file). Your dashboard does not have to look exactly like this--this is just to serve as a guide. Dataset summary Visualization containing insights Visualization containing insights Linear Optionation The Amazon sales dataset includes 1,465 ercentage vs. Rating Rating Distribution Across Top Product Categories Optimal Product Mix for Revenue Maximization 5.0 product listings from Amazon India, 4.5 490 featuring pricing, ratings, categories, and 5 300 200 - customer reviews (Amazon Sales Dataset, 2.0 2.5 100 2023). It offers a solid base for analysing 2.0- pricing strategies, customer sentiment, Eureka Vacuum and product performance in e-commerce |Discounts show minimal effect on product ratings Satisfaction is high in Office and Computer The model finds the most cost-efficient product mix while (Mehakiftikhar, 2024). based on weak negative correlation. categories; meeting inventory and budget limits, enhancing resource Summary of Descriptive Statistics Correlations & Linear Regression Prediction Question to answer: Optimal campaign under demand uncertainty Descriptive Statistics Summary for Amazon Rating Count Trend Product Pricing and Ratings - Actual Rating Count Applied method: Used Maximin, Maximax, Laplace, Regret Regret Table by Strategy 35 Launch Small Campaign 30 Launch Large Campaign 25 20 100900 15 10 Prediction shows price drives discount. 200 This analysis illustrates the pricing trends, Summary reveals high average ratings. 460 Product index (simulated Timejose 1200 1400 Low Demand Demand Scenario High Demand discounts & customer satisfaction Discovery shows price doesn't influence satisfaction. Forecast shows rising consumer rating trends. Decision: Launch large campaign for higher returns More visualiztion section if you need THESE ARE SUGGESTIONS... You can move them around and add whatever you think will make it better. BUT... do not remove or change the order of worksheets. There one worksheet for dataset at the end. Add as n\"Final Excel Template LINK" https: //docs.google.com/spreadsheets/d/1jchDz4mo1VrOWS4VLxeM_weYvMJhagND /edit? usp=drive_link&ouid=106800931177367020581&rtpof=true&sd=true Applying Data Analytics for Strategic Decision-making Explore data analytics, data visualization, and its strategic implications within retail industry of your choice. You will select a dataset from a publicly available database and use it to create and justify visualizations that effectively communicate key insights. For this assignment, you will submit 1 Excel file that contains separate worksheet(s) for data, and worksheets as described below. Use the template provided. Make sure the worksheets are in the below order, with your dataset worksheet(s) at the end. Each worksheet should have a short description to provide a summary of what you did, the results, and conclusions (3-5 statements, in a clearly marked text box). The rest of the worksheet should include calculations, statistics, analytics, and anything else you used. Each worksheet must have at least 1 visualization to help depict your data, results, or findings. Assignment Worksheets 1. \"Dashboard\" worksheet o The dashboard is the most important worksheet of your work, and most likely you will develop it last. It should tell the whole story you are trying to tell through other worksheets and use the one-page space for the reader to know all there is to know. Think of this as an infographic with statistical analysis, data analysis, and the right mix of text and visualizations. You should cover: 1. Industry/dataset: Chosen industry of interest (e.g., healthcare, finance, retail), dataset size and geography, etc. Note: | choose retail industry. 2. Objective: Questions you are trying to answer 3. Statistical analysis: You can use visualizations 4. Data analytics: choose the right mixture of results of other worksheets and visualizations. 5. Results: visualizations mixed with text that show the results you concluded. o Dashboard should contain the best of visualizations, analysis, calculations and everything else we need to know. If done correctly, it is the only place executive members of the team need to see. o Dashboard should be visible in 1 screen, no scrolls required. Ifyou use other tools like Tableau, you can provide a screenshot of dashboard from Tableau but also provide a proper public link for your professor to verity. 2. \"Descriptive Statistics\" Worksheet o Key Insights: Choose various fields of your dataset to show various descriptive statistics. Try to find meaningful insights between them across the data points you have. o Visualizations Chosen: Use visualizations to bring these insights to life. 3. \"Correlation and Linear Regression\" worksheet o Description: Choose field or fields of data that seem to be dependent on others. In the description, provide information about these, and interpretation of results. Make a prediction based on regression line. Correlation analysis: Clearly mark (highlight) data fields used, correlation values. o Regression analysis: Clearly mark (highlight) data fields used and provide regression line visualization. ization\" worksheet 4, \"Linear Opti o Description: Describe a case based on what you have learned in previous worksheets, establish at least one linear optimization problem. This can be about optimizing resources, maximizing a parameter like sales, profit, engagement, or any other variable that you want to see how to optimize. Briefly discuss the results (3-5 statements). o Modeland solution: Follow guidelines to build the LP model. Add required limitations and assumptions. Clearly mark the optimization equation. Solve the problem. o Visualization: Provide the visualization for your model and solution. 5. \"Prediction\" worksheet o Description: Describe a scenario based on previous worksheets and make predictions about the future of industry. Use any of the models learned in the classroom. o Visualization: Support your prediction with visualization(s). 6. \"Decision\" worksheet o Description: Based on all you have learned, come up with 2 alternatives for a future state of the your industry. What are the uncertain variables, and what's the probability and utility of each. Based on criteria, show the results and decision you recommend a company in the industry should take on. Criteria: Based on your knowledge of industry, choose at Least 2 decision criteria from maximin, maximax, laplace, minimax regret; provide reason of choice. o Calculations: perform calculations. You may need to find extra data from various sources. If you have to make assumptions to fill in the blanks, please identify all the assumptions clearly. 7. \"References\" worksheet co Provide all sources in proper APA format. 8. \"Notes\" worksheet o Anything you want to communicate with your professor. It's ok to leave it empty. Submission Format: Single Excel document with embedded or linked visualizations. * Rubrics: Make sure to follow the rubrics and cover all the requested points. * Standard APA referencing and citations is required on sources used for data, industry moves and future possibilities. Rubrics: Criteria Level 4 (Excellent) Level 3(Good) (Level 2(Satisfactory)/Level1(Needs [% Improvement) Dashboard ALL points covered, ALL or most of Some points missing,/Developing, major25% Exemplary, containing |points covered, jor need lots of improvements realistic insights few improvements required based on dataset improvements required Descriptive ALL points covered, ALL or most of Some points missing,/Developing, major10% Statistics Exemplary points covered, jor need lots of improvements few improvements required Improvements required Correlation and |All points covered, ALL or most of Some points missing,/Developing, major15% Linear Exemplary points covered, jor need lots of improvements Regression few improvements required Improvements required Linear ALL points covered, ALL or most of Some points missing,|Developing, major[15% Optimization Exemplary points covered, jor need lots of improvements few improvements required improvements required Prediction ALL points covered, All or most of Some points missing,|Developing, major10% Exemplary points covered, jor need lots of improvements few improvements required improvements required Decision ALL points covered, ALL or most of Some points missing,/Developing, major15% Exemplary points covered, jor need lots of improvements few improvements required improvements required Documentation |Flawless writing Writing is clear ritingis adequate = |Writing has 10% & Formatting quality, adheres to with minimal but may have significant issues APA formatting, stays jerrors.Mostly (grammar issues, (grammar, within the word limit, follows APA APA structure). APA and uses credible, format, with inconsistencies, or (formatting is properly cited minorissuesin |poororganization. [incorrect or sources. citations or May be over/under [missing citations. formatting. word limit. Does not adhere to word limits. [Total 100%
Step by Step Solution
There are 3 Steps involved in it
1 Expert Approved Answer
Step: 1 Unlock
Question Has Been Solved by an Expert!
Get step-by-step solutions from verified subject matter experts
Step: 2 Unlock
Step: 3 Unlock
Students Have Also Explored These Related General Management Questions!