

Question: Data Analytics for Management (MGMT-540-9) Turnitin: This assignment will be submitted to Turnitin?. Instructions Please follow the instructions in Final -2025 attached. Use the Final
Data Analytics for Management (MGMT-540-9)
Turnitin: This assignment will be submitted to Turnitin?.
Instructions Please follow the instructions in Final -2025 attached. Use the Final Excel Template for submitting your assignment.
Final Excel Template LINK: https://docs.google.com/spreadsheets/d/1jchDz4mo1VrOW54VLxeM_weYvMJhagND/edit?usp=drive_link&ouid=106800931177367020581&rtpof=true&sd=true
Applying Data Analytics for Strategic Decision-making
Explore data analytics, data visualization, and its strategic implications within an industry of your choice. You will select a dataset from a publicly available database and use it to create and justify visualizations that effectively communicate key insights.
For this assignment, you will submit 1 Excel file that contains separate worksheet(s) for data, and worksheets as described below. Use the template provided. Make sure the worksheets are in the below order, with you dataset worksheet(s) at the end.
Each worksheet should have a short description to provide a summary of what you did, the results, and conclusions (3-5 statements, in a clearly marked text box). The rest of the worksheet should include calculations, statistics, analytics, and anything else you used. Each worksheet must have at least 1 visualization to help depict your data, results, or findings.
Assignment Worksheets
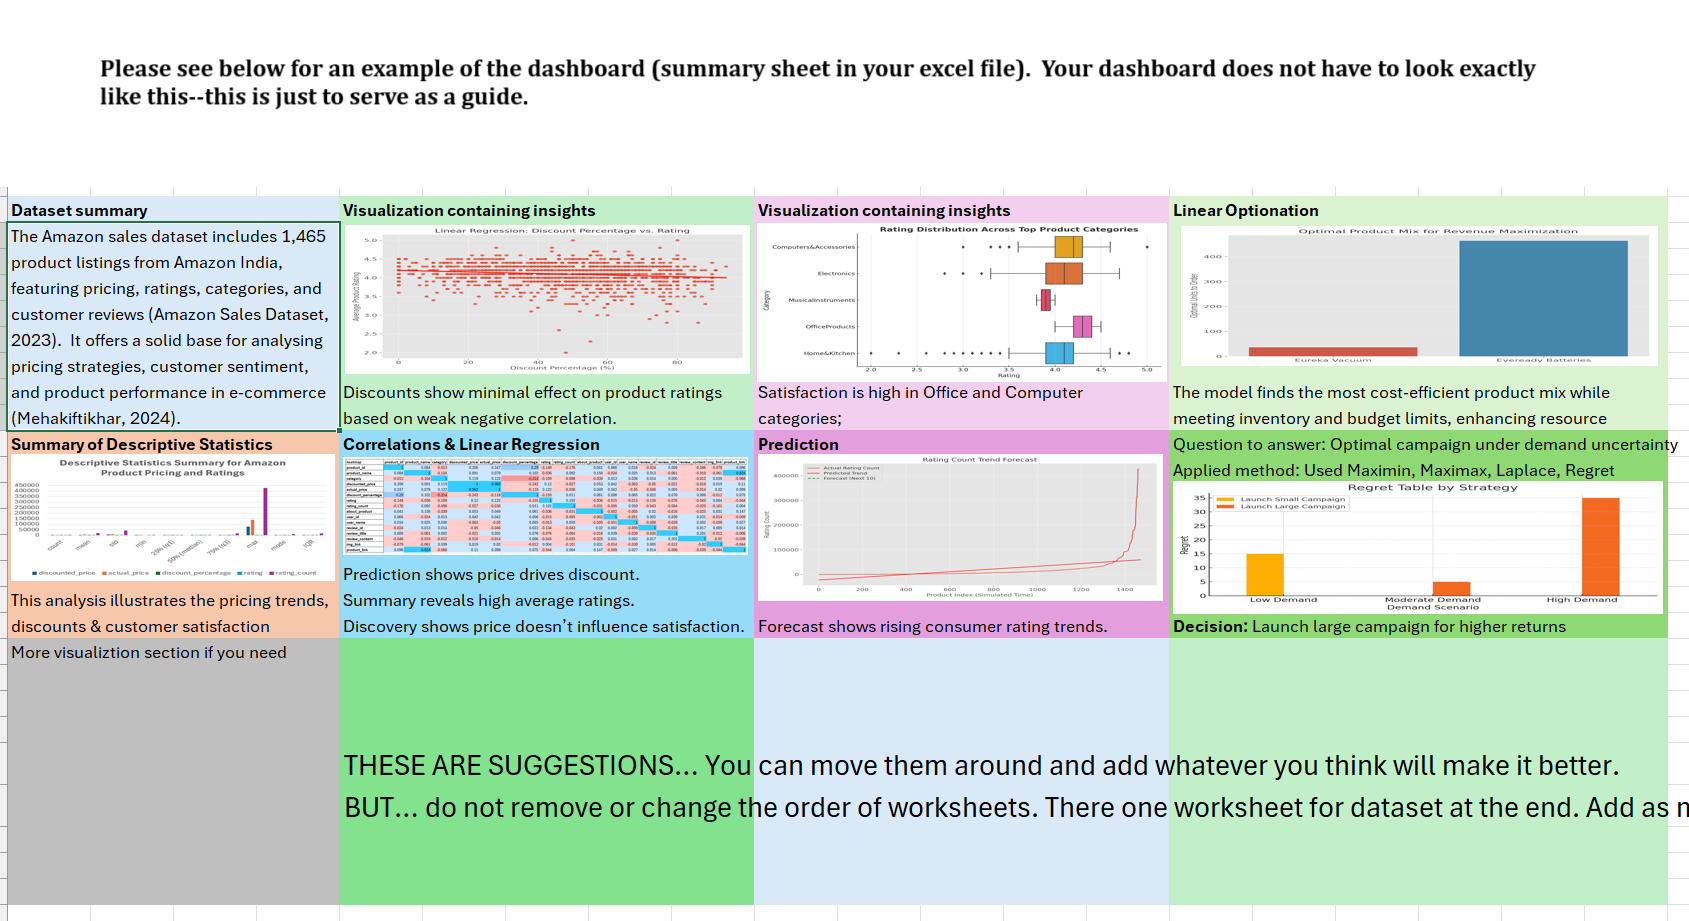
- "Dashboard" worksheet
- The dashboard is the most important worksheet of your work, and most likely you will develop it last. It should tell the whole story you are trying to tell through other worksheets and use the one-page space for the reader to know all there is to know. Think of this as an infographic with statistical analysis, data analysis, and the right mix of text and visualizations. You should cover:
- Industry/dataset: Chosen industry of interest (e.g., healthcare, finance, retail), dataset size and geography, etc.
- Objective: Questions you are trying to answer
- Statistical analysis: You can use visualizations
- Data analytics: choose the right mixture of results of other worksheets and visualizations.
- Results: visualizations mixed with text that show the results you concluded.
- Dashboard should contain the best of visualizations, analysis, calculations and everything else we need to know. If done correctly, it is the only place executive members of the team need to see.
- Dashboard should be visible in 1 screen, no scrolls required.
- If you use other tools like Tableau, you can provide a screenshot of dashboard from Tableau but also provide a proper public link for your professor to verify.
- The dashboard is the most important worksheet of your work, and most likely you will develop it last. It should tell the whole story you are trying to tell through other worksheets and use the one-page space for the reader to know all there is to know. Think of this as an infographic with statistical analysis, data analysis, and the right mix of text and visualizations. You should cover:
- "Descriptive Statistics" Worksheet
- Key Insights: Choose various fields of your dataset to show various descriptive statistics. Try to find meaningful insights between them across the data points you have.
- Visualizations Chosen: Use visualizations to bring these insights to life.
- "Correlation and Linear Regression" worksheet
- Description: Choose field or fields of data that seem to be dependent on others. In the description, provide information about these, and interpretation of results. Make a prediction based on regression line.
- Correlation analysis:Clearly mark (highlight) data fields used, correlation values.
- Regression analysis: Clearly mark (highlight) data fields used and provide regression line visualization.
- "Linear Optimization" worksheet
- Description: Describe a case based on what you have learned in previous worksheets, establish at least one linear optimization problem. This can be about optimizing resources, maximizing a parameter like sales, profit, engagement, or any other variable that you want to see how to optimize. Briefly discuss the results (3-5 statements).
- Model and solution:Follow guidelines to build the LP model. Add required limitations and assumptions. Clearly mark the optimization equation. Solve the problem.
- Visualization: Provide the visualization for your model and solution.
- "Prediction" worksheet
- Description: Describe a scenario based on previous worksheets and make predictions about the future of industry. Use any of the models learned in the classroom.
- Visualization: Support your prediction with visualization(s).
- "Decision" worksheet
- Description:Based on all you have learned, come up with 2 alternatives for a future state of the your industry. What are the uncertain variables, and what's the probability and utility of each. Based on criteria, show the results and decision you recommend a company in the industry should take on.
- Criteria:Based on your knowledge of industry, choose at least 2 decision criteria from maximin, maximax, laplace, minimax regret; provide reason of choice.
- Calculations: perform calculations. You may need to find extra data from various sources. If you have to make assumptions to fill in the blanks, please identify all the assumptions clearly.
- "References" worksheet
- Provide all sources in proper APA format.
- "Notes" worksheet
- Anything you want to communicate with your professor. It's ok to leave it empty.
Submission
- Format: Single Excel document with embedded or linked visualizations.
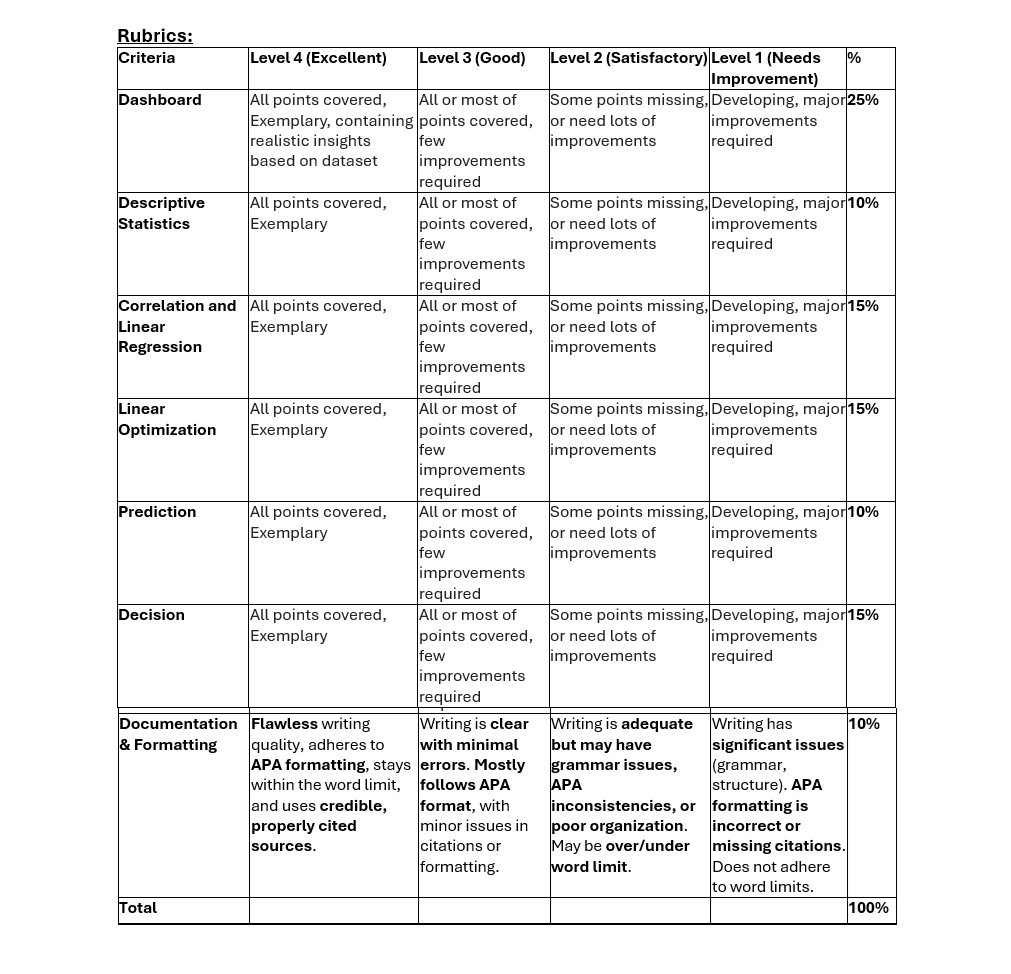
- Rubrics: Make sure to follow the rubrics and cover all the requested points.
- Standard APA referencing and citations is required on sources used for data, industry moves and future possibilities.
Step by Step Solution
There are 3 Steps involved in it

Get step-by-step solutions from verified subject matter experts