

Question: Data Analytics I Assignment 1 South Australian elections have just concluded and one of the most talked about topics was ramping in SA hospitals. Consider
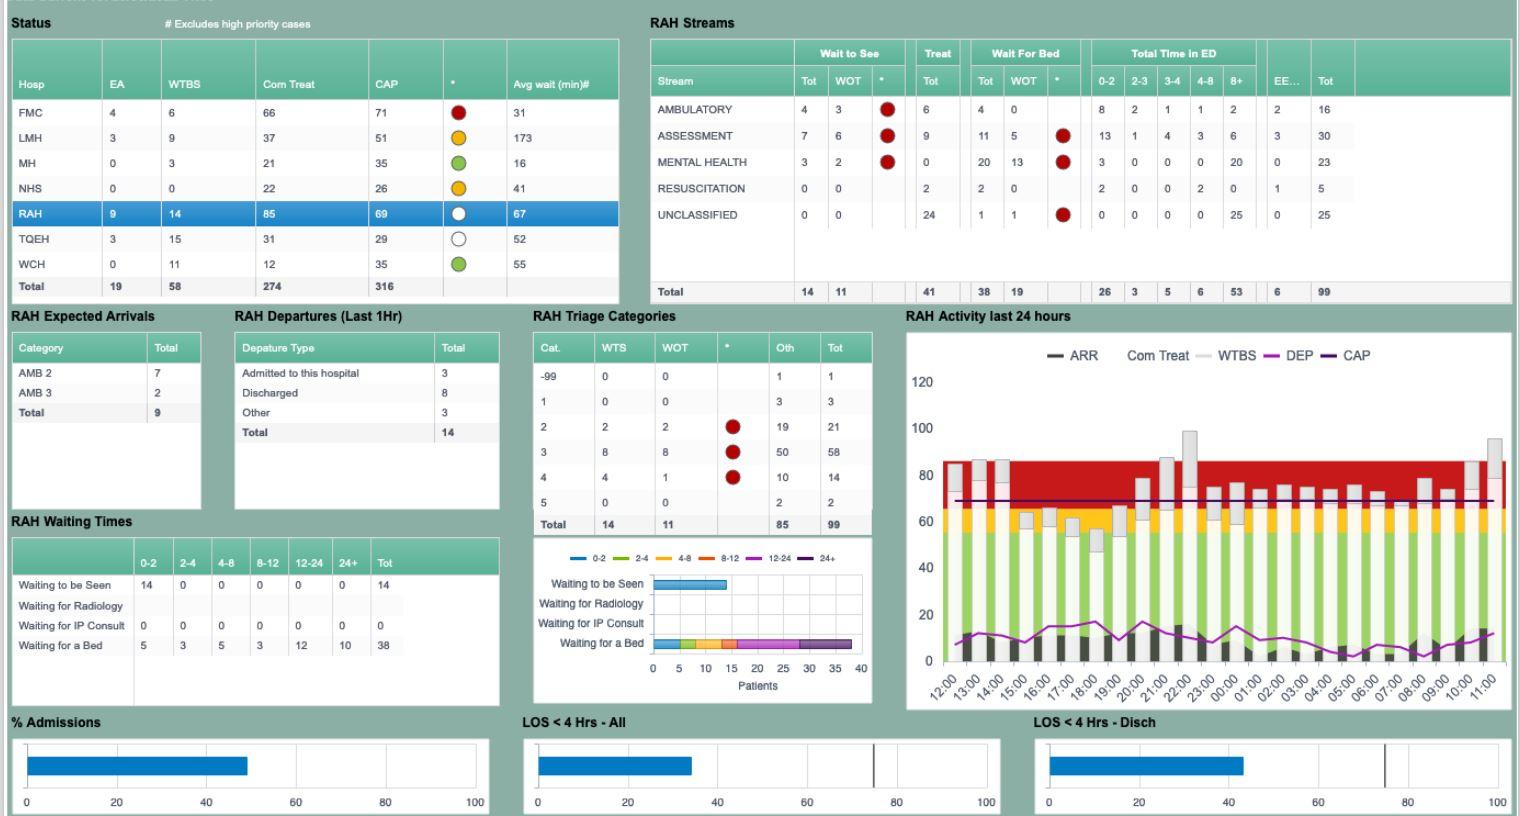
Data Analytics I Assignment 1 South Australian elections have just concluded and one of the most talked about topics was ramping in SA hospitals. Consider the information provided in the Data Ramping RAH.pdf file. The information was downloaded from the SA Health website on 23 March 2022, at 11:30am. Please answer the following questions. Make sure to explain your answers: 1. Consider the RAH Waiting Times Table. What type of Data is used in this Table? (5 points) 2. Consider the RAH Waiting Times Table, and in particular, the Waiting for a Bed category. Using Excel, build a histogram for that data. Include graph title and labels on the axis. Make sure the labels on your graph match those in the Table. (15 points) 3. Could the visualisation of the data you provided in the above question be improved. If yes, how and why is it an improvement? If no, explain why it cannot be improved. (15 points) 4. Consider now the Avg Wait (min) category of the Status Table. (a) Draw a graph that captures the frequencies of the Avg Wait (min) category. Make sure to include graph title and labels, and explain your choice of graph. (15 points) (b) Compute the average, median, 1st quartile, 3rd quartile and variance of the Avg Wait (min) category. (10 points) Consider now the following Table with information from the National Drug Strategy Household Survey: Drug Usage by Gender (in %) in 2019 Male (M) Female (F) Illicit use of any drug in lifetime (I) 46.9 39.6 No drug use (N) 53.1 60.4 5. Using the information provided in the Table above, and assuming that the population considered is composed of 50% Males and 50% Females, build the corresponding contingency Table. (8 points) 6. Compute the following probabilities: (a) P(I M), P(I F), P(N M), P(N F) (8 points) (b) P(I), P(N), P(M), P(F) (8 points) (c) P(I|M), P(I|F), P(N|M), P(N|F) (8 points) 7. Are males more likely to use any illicit drug in a lifetime? Explain carefully your answer using the definition of independent events. (8 points) Page 1 of 2 Submit your answer by uploading two files: one Excel file with the graphs you have drawn and statistics you have calculated, and a pdf document with the answers to the above questions, as well as your explanations. The pdf document should be typed and NOT exceed 2 pages in length, with 11 pts font and regular spacing and margins. Make sure references to your graphs in your excel files are clear so that we know which graph(s) you are talking about. Failure to do so may lead to a loss of marks
Step by Step Solution
There are 3 Steps involved in it

Get step-by-step solutions from verified subject matter experts