

Question: Data Analytics: Use Excel Pivot Table and Visualization in Activity - Based Costing Adams Inc., a local shipping company, provides commercial and residential delivery services.
Data Analytics: Use Excel Pivot Table and Visualization in ActivityBased Costing
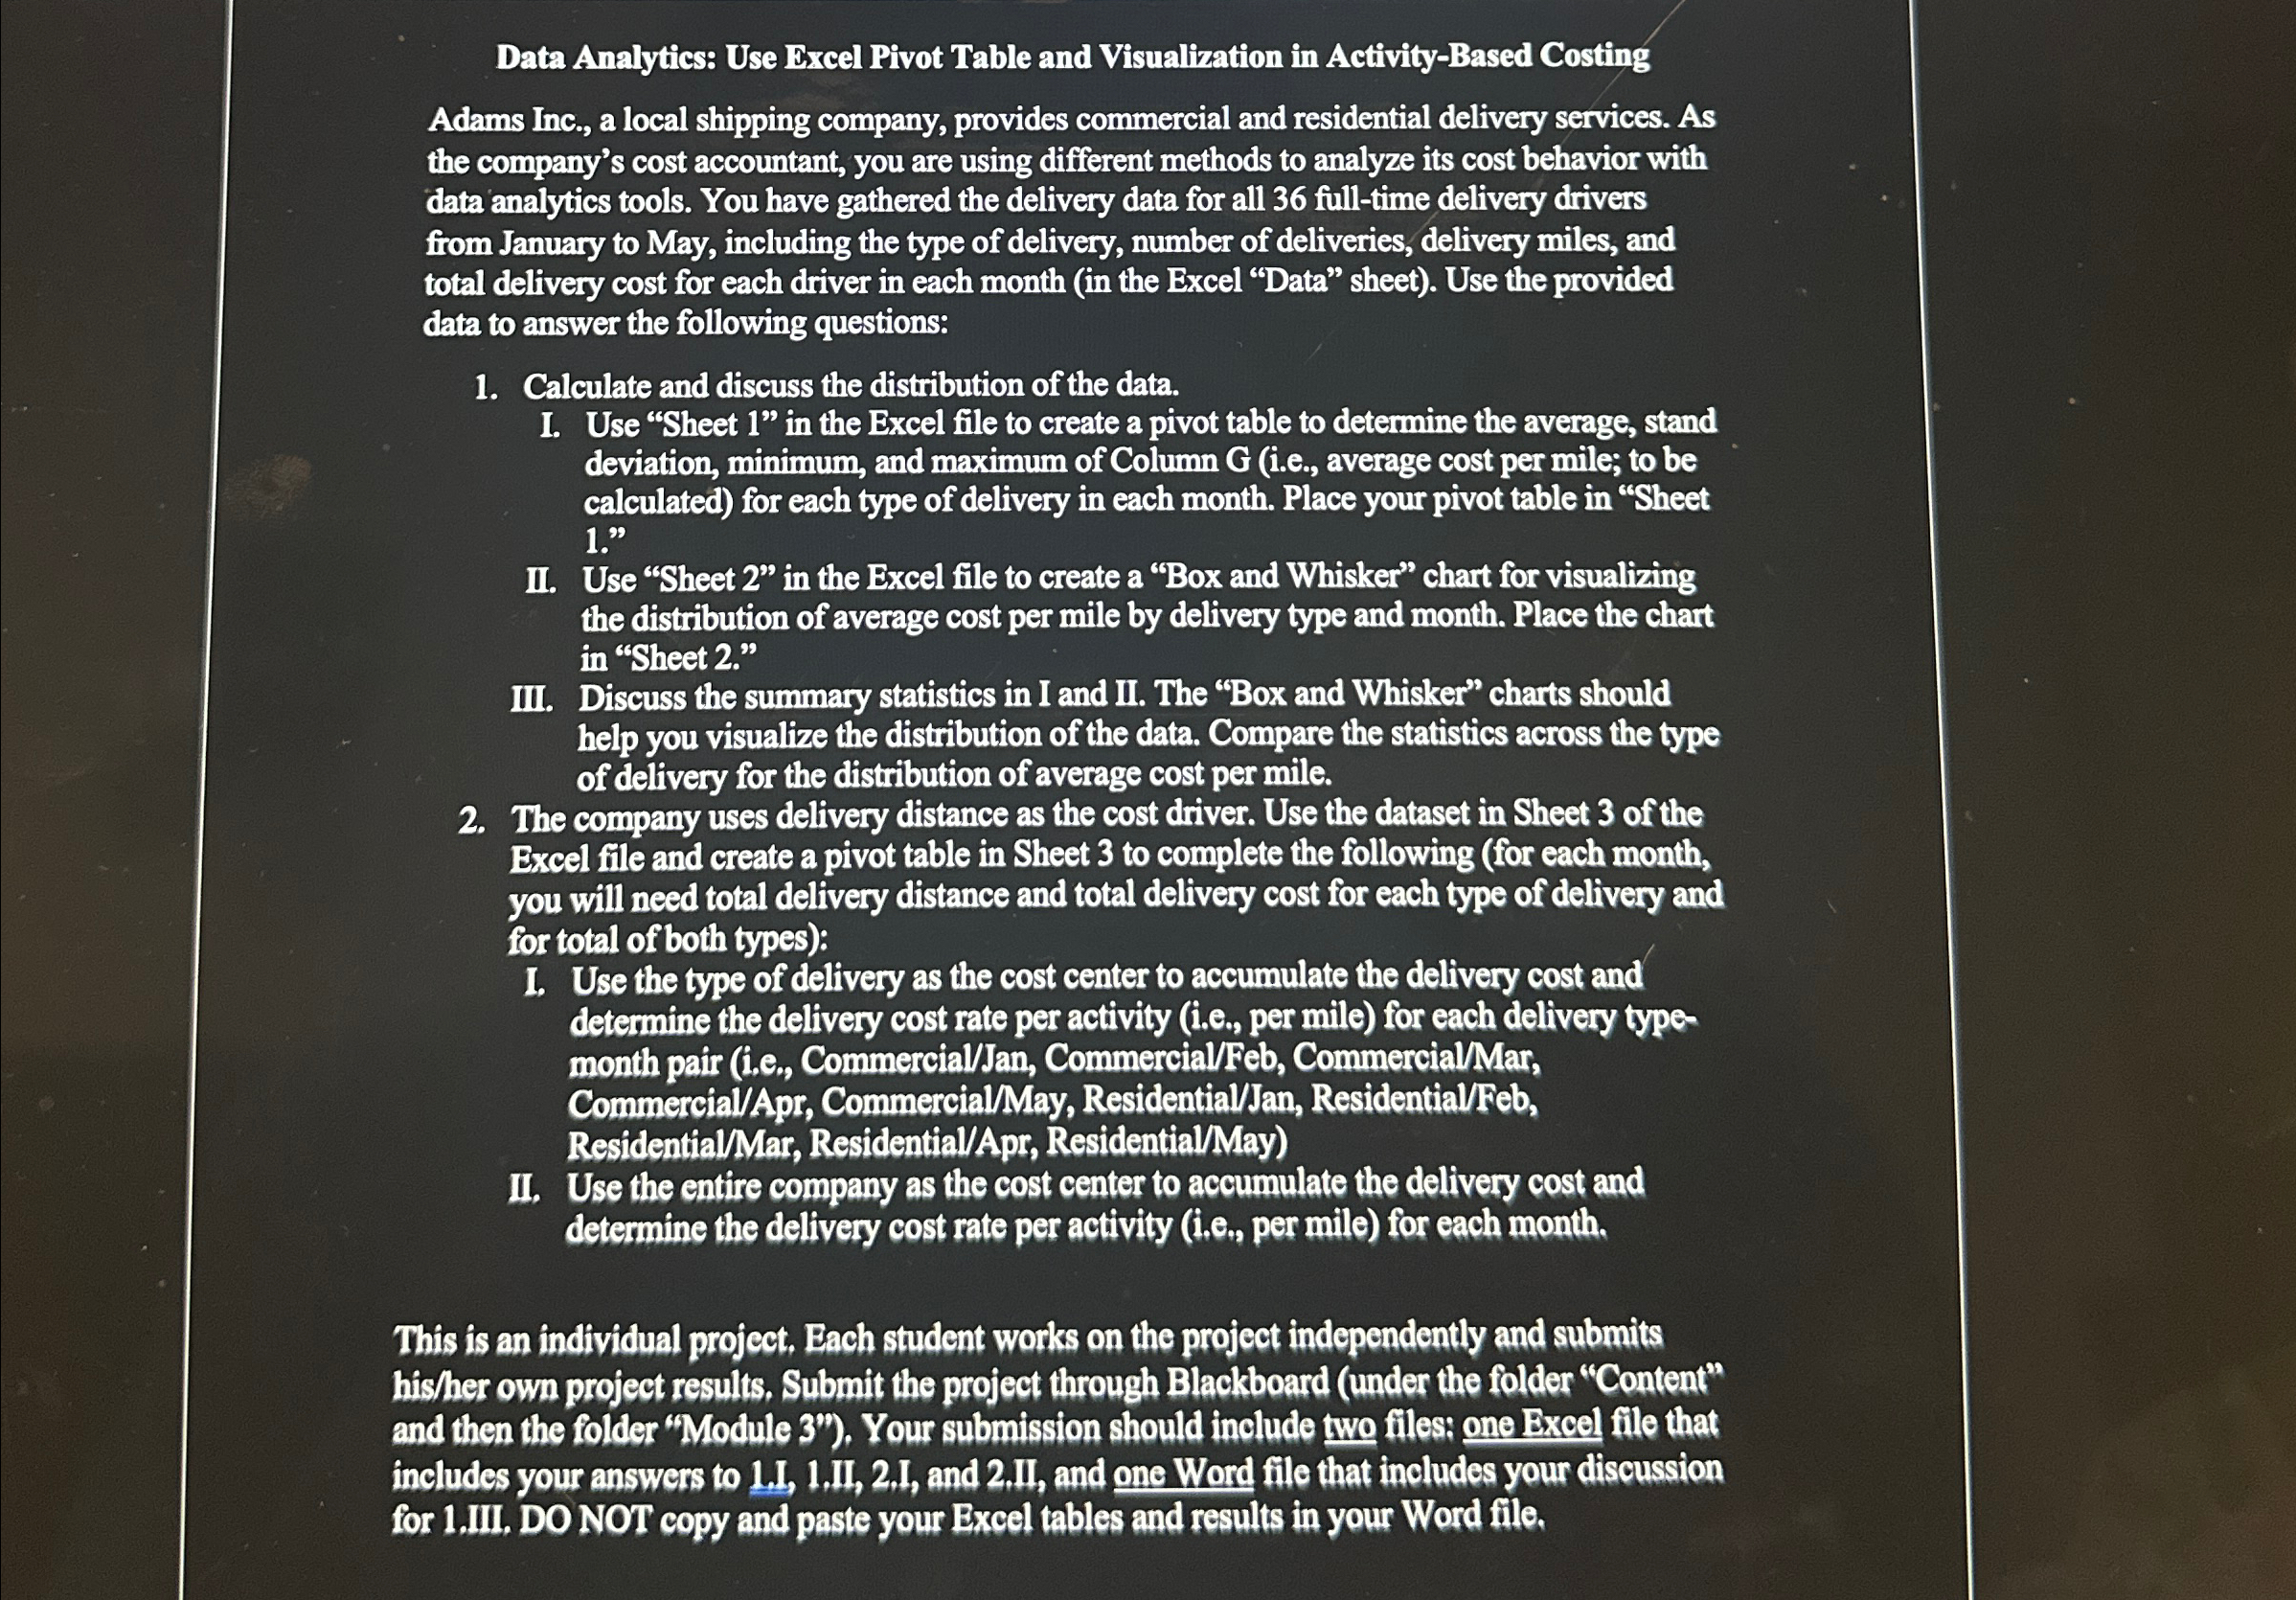
Adams Inc., a local shipping company, provides commercial and residential delivery services. As the company's cost accountant, you are using different methods to analyze its cost behavior with data analytics tools. You have gathered the delivery data for all fulltime delivery drivers from January to May, including the type of delivery, number of deliveries, delivery miles, and total delivery cost for each driver in each month in the Excel "Data" sheet Use the provided data to answer the following questions:
Calculate and discuss the distribution of the data.
I. Use "Sheet in the Excel file to create a pivot table to determine the average, stand deviation, minimum, and maximum of Column ie average cost per mile; to be calculated for each type of delivery in each month. Place your pivot table in "Sheet
II Use "Sheet in the Excel file to create a "Box and Whisker" chart for visualizing the distribution of average cost per mile by delivery type and month. Place the chart in "Sheet
III. Discuss the summary statistics in I and II The "Box and Whisker" charts should help you visualize the distribution of the data. Compare the statistics across the type of delivery for the distribution of average cost per mile.
The company uses delivery distance as the cost driver. Use the dataset in Sheet of the Excel file and create a pivot table in Sheet to complete the following for each month, you will need total delivery distance and total delivery cost for each type of delivery and for total of both types:
I. Use the type of delivery as the cost center to accumulate the delivery cost and determine the delivery cost rate per activity ie per mile for each delivery typemonth pair ie CommercialJan CommercialFeb CommercialMar CommercialApr CommercialMay ResidentialJan ResidentialFeb ResidentialMar ResidentialApr ResidentialMay
II Use the entire company as the cost center to accumulate the delivery cost and determine the delivery cost rate per activity ie per mile for each month.
This is an individual project. Each student works on the project independently and submits hisher own project results. Submit the project through Blackboard under the folder "Content" and then the folder "Module Your submission should include two files: one Excel file that includes your answers to LI, III, and II and one Word file that includes your discussion for III. DO NOT copy and paste your Excel tables and results in your Word file.

Step by Step Solution
There are 3 Steps involved in it
1 Expert Approved Answer
Step: 1 Unlock

Question Has Been Solved by an Expert!
Get step-by-step solutions from verified subject matter experts
Step: 2 Unlock
Step: 3 Unlock