

Question: DATA and assumptions: Q R = 2 0 m 3 h r - 1 Q w = 1 m 3 h r - 1 V
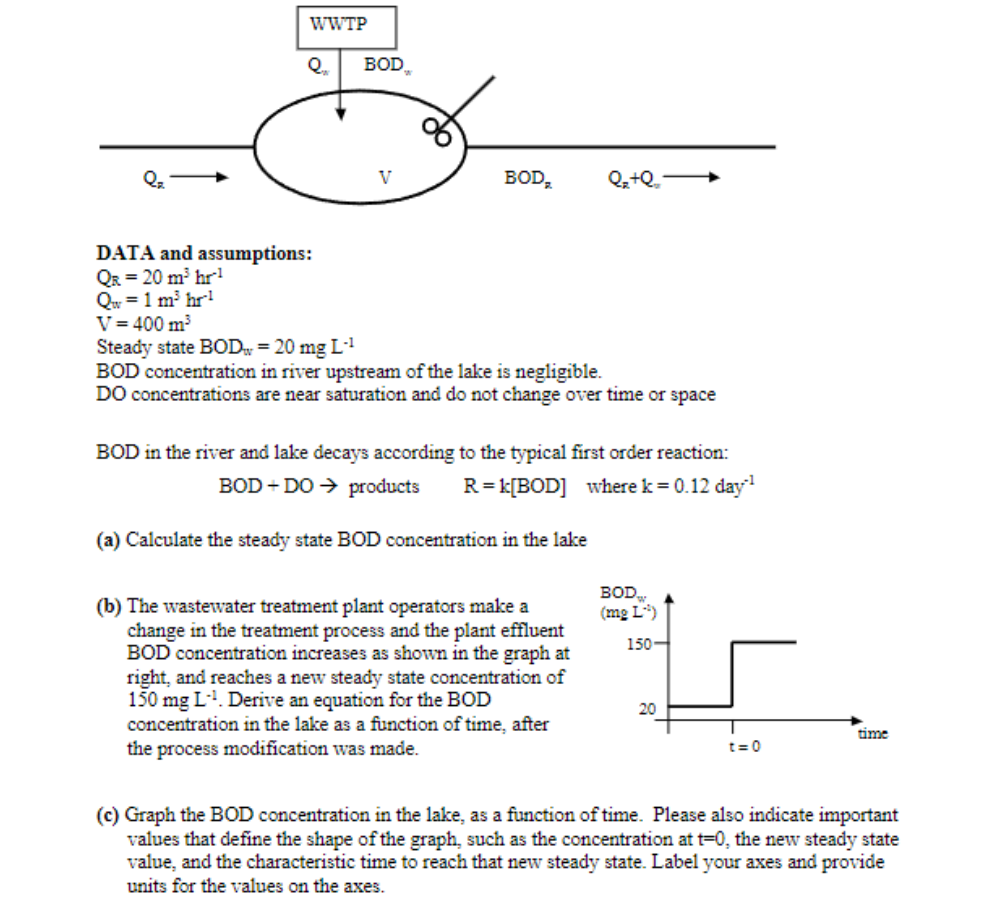
DATA and assumptions:
Steady state
BOD concentration in river upstream of the lake is negligible.
DO concentrations are near saturation and do not change over time or space
BOD in the river and lake decays according to the typical first order reaction:
BOD products where
a Calculate the steady state BOD concentration in the lake
b The wastewater treatment plant operators make a
change in the treatment process and the plant effluent
BOD concentration increases as shown in the graph at
right, and reaches a new steady state concentration of
Derive an equation for the BOD
concentration in the lake as a function of time, after
the process modification was made.
c Graph the BOD concentration in the lake, as a function of time. Please also indicate important
values that define the shape of the graph, such as the concentration at the new steady state
value, and the characteristic time to reach that new steady state. Label your axes and provide
units for the values on the axes.
Step by Step Solution
There are 3 Steps involved in it
1 Expert Approved Answer
Step: 1 Unlock

Question Has Been Solved by an Expert!
Get step-by-step solutions from verified subject matter experts
Step: 2 Unlock
Step: 3 Unlock