

Question: Data box plot 4 questions The data modeled by the box plots represent the battery life of two different brands of batteries that Mary tested.


Data box plot 4 questions
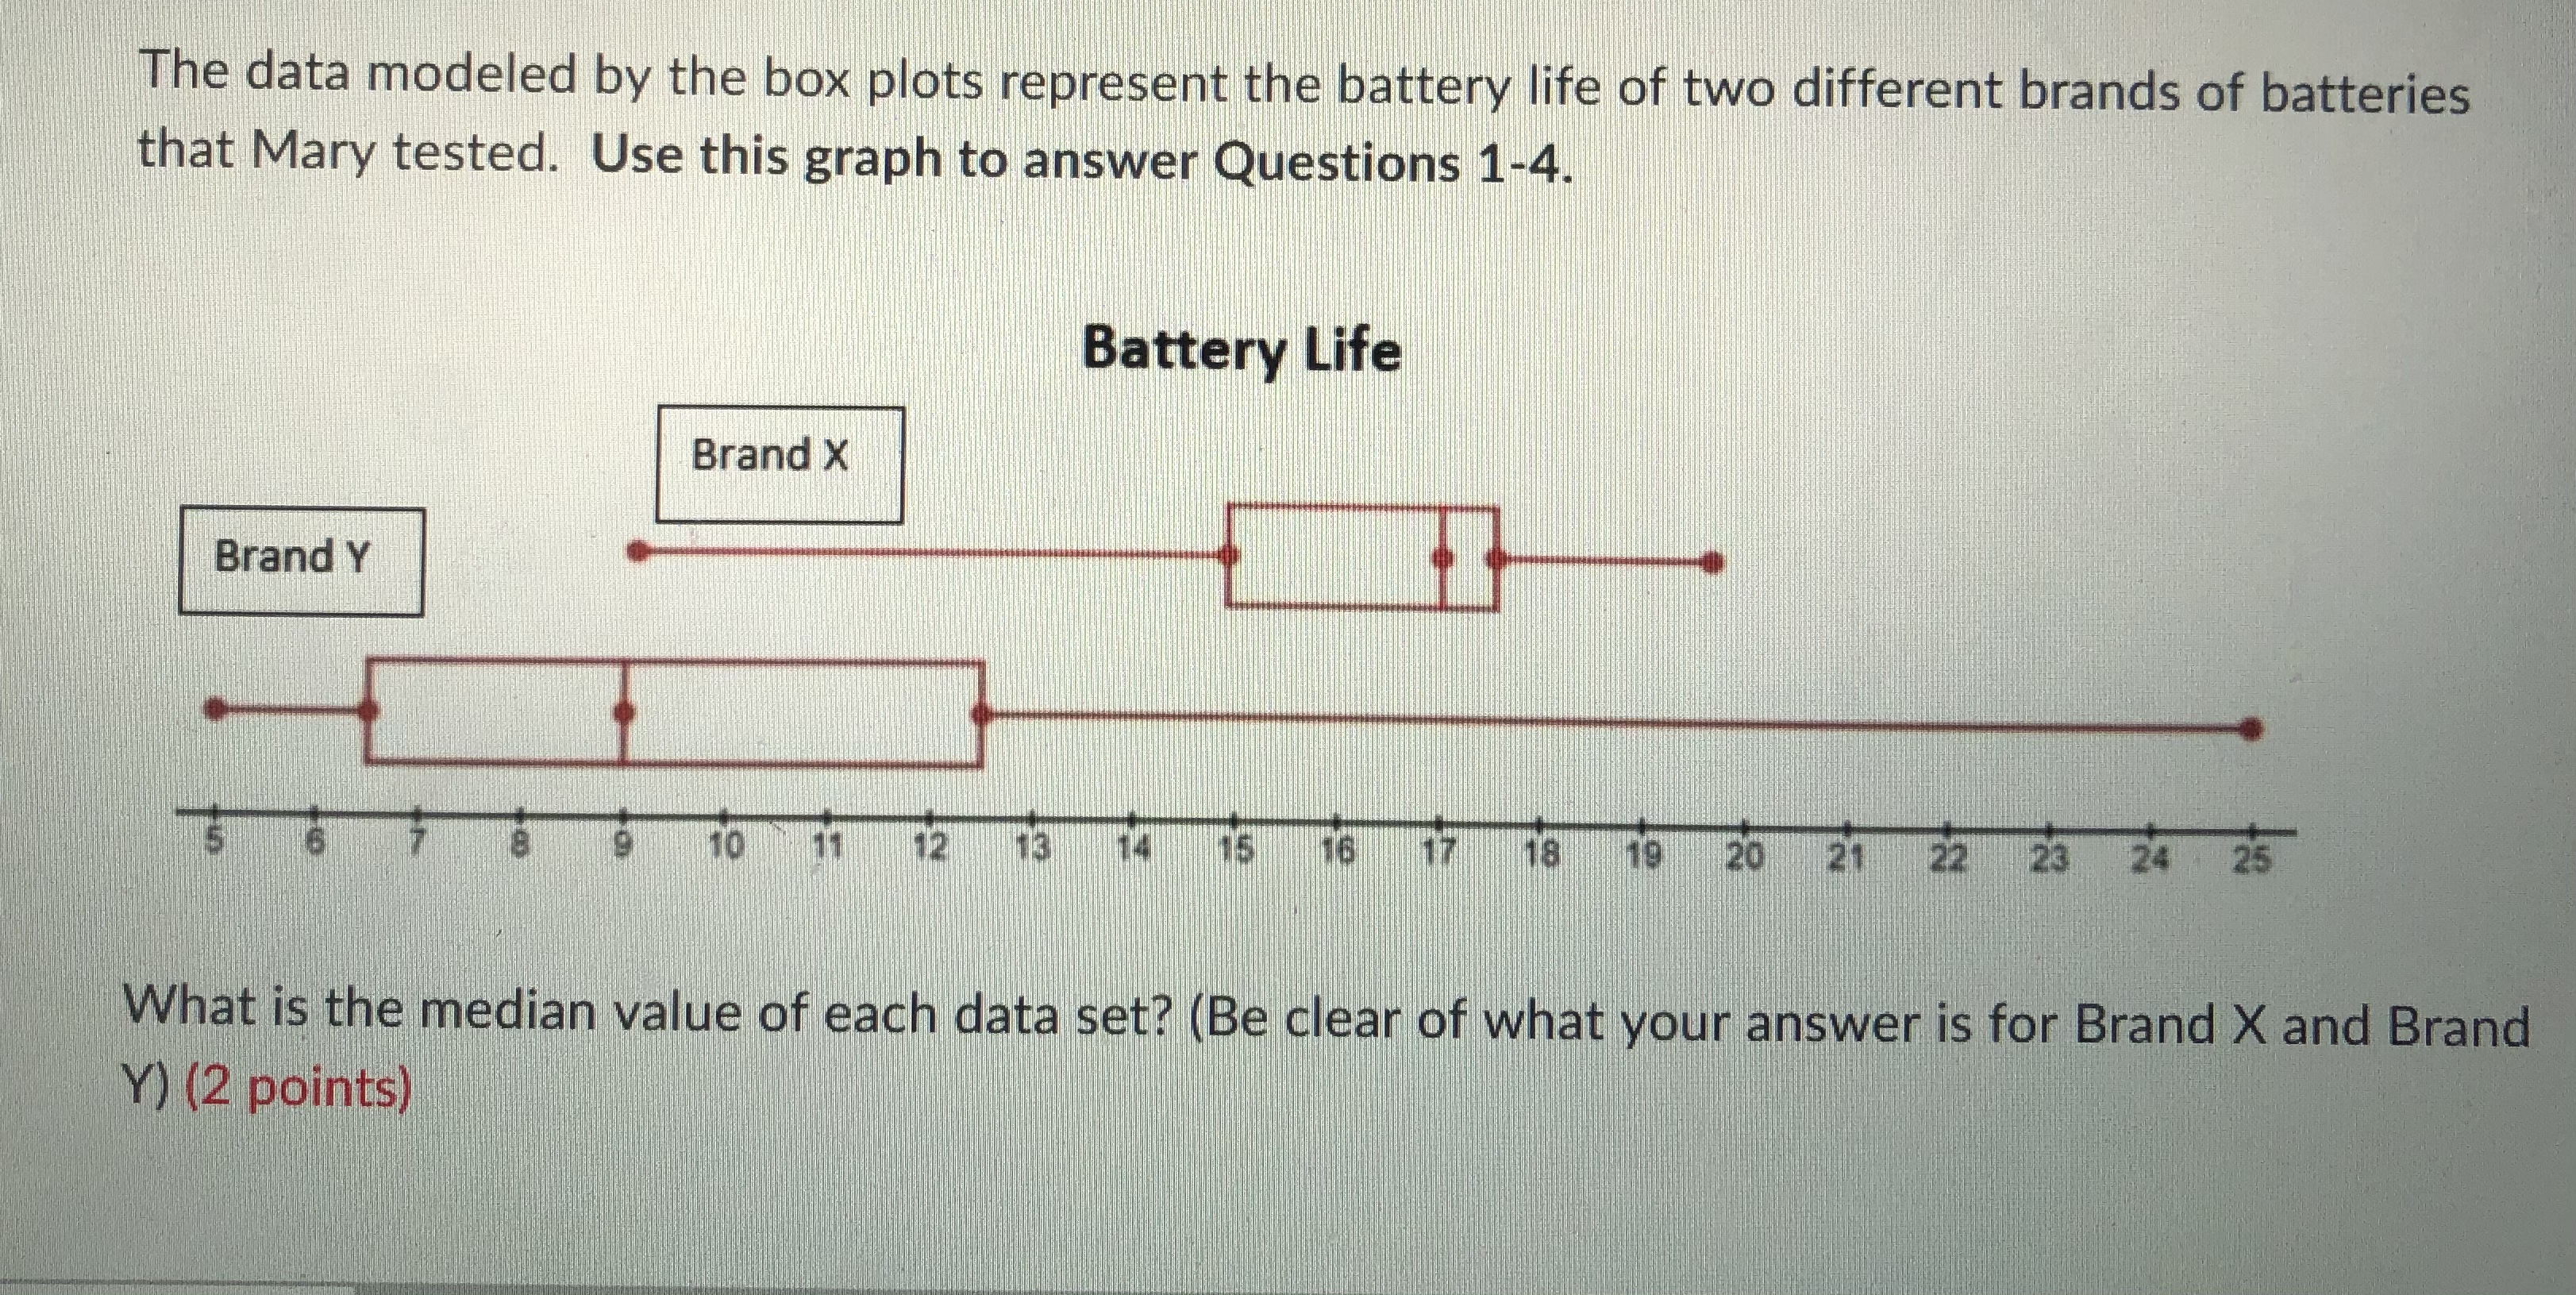

The data modeled by the box plots represent the battery life of two different brands of batteries that Mary tested. Use this graph to answer Questions 1-4. Battery Life Brand X Brand Y 10 12 13 15 16 18 19 20 21 22 23 24 25 What is the median value of each data set? (Be clear of what your answer is for Brand X and Brand Y) (2 points)Question 2 (2 points) Compare the median values of the data sets by stating which one is greater and what their difference is. What does this comparison tell you in terms of the situation the data represent? (2 points) Format V BI U A/Question 3 (2 points) What is the range in battery life for Brand Y? What does this tell you about this brand? (2 points) Format V BIU . . . A/Question 4 (2 points) If Mary bought 12 of the Brand X batteries, how many of them lasted less than 15 hours? (Please show how you calculated this to get your answer) (2 points) Paragraph BI U - H A/
Step by Step Solution
There are 3 Steps involved in it

Get step-by-step solutions from verified subject matter experts