

Question: Data can be found under p chart tab in the same Excel file as before ( same file, different worksheet ). Question 20 to 23
-
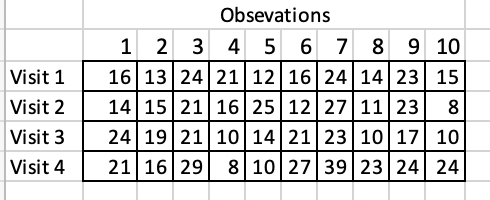
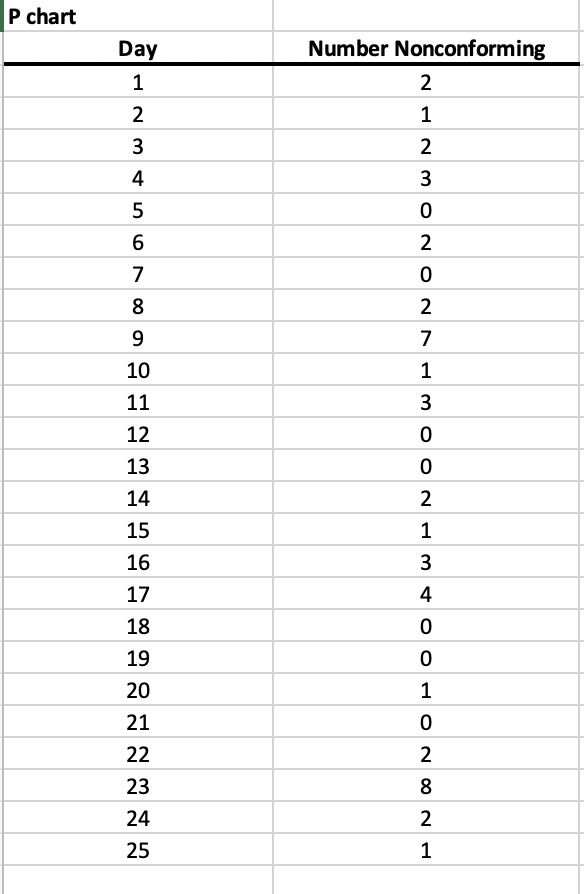
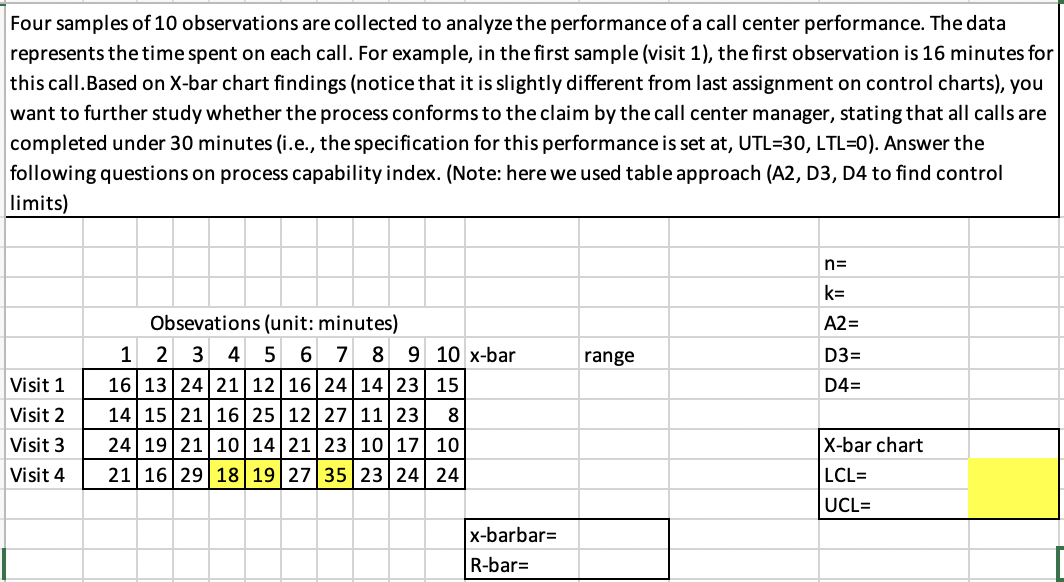
 Data can be found under "p chart" tab in the same Excel file as before (same file, different worksheet). Question 20 to 23 are based on this data. 100 insurance claim forms are inspected daily for 25 working days, and the number of forms with errors is recorded. Construct p- chart and answer questions based on your LCL and UCL.
What is p8? (non-conformance or defective percentage for the 8th sample)
Round your answer to the nearest whole number and ignore the percentage sign. For example, if your answer is 0.45 or 45%, fill in 45; if your answer is 0.76 or 76%, fill in 76.
1 points
QUESTION 21
-
What is standard deviation of the mean percentage? (sigma) Round your answer to 2 decimals and ignore the percentage sign. Careful here! Tip: change it to % first, then round to two decimals. For example, if your answer is 0.04511, change it to 4.511%, fill in 4.51. Or, if your answer is 0.00123, change it to 0.123% (they are equal), you should fill in 0.12.
1 points
QUESTION 22
-
What is the UCL for this p chart? Round your answer to two decimals, and ignore the percentage sign. Tip: change it to % first, then round to two decimals. For example, if your answer is 0.04511, change it to 4.511%, fill in 4.51.
1 points
QUESTION 23
-
From your p-chart, how many special cause variations did you identify? Round your answer to the nearest whole number.
1 points
QUESTION 24
-
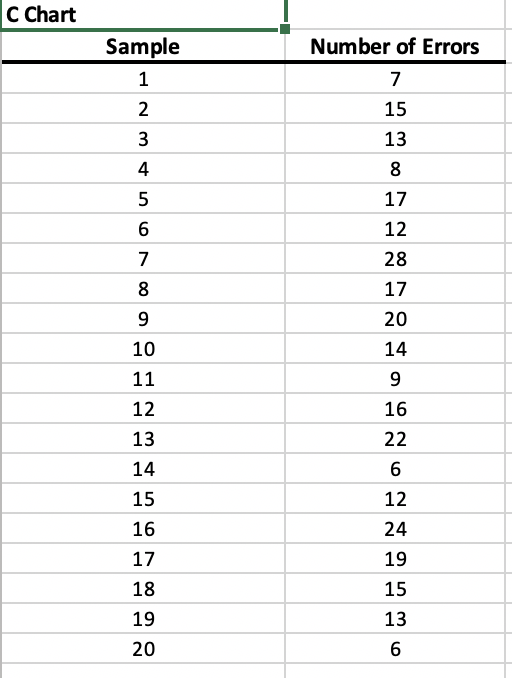
Data can be found from tab "c chart". Data show the coding errors found from 20 samples. Construct c chart to answer questions. What is c-bar? Round your answer to two decimals.
1 points
QUESTION 25
-
What is UCL of c chart? Round your answer to two decimals.
1 points
QUESTION 26
-
How many special cause variation did you identify?
Step by Step Solution
There are 3 Steps involved in it

Get step-by-step solutions from verified subject matter experts