

Question: Data case 1 Econ 670 Problem 4 (10 points) Show all your work to receive full credit. Completed assignments will include an Excel file with
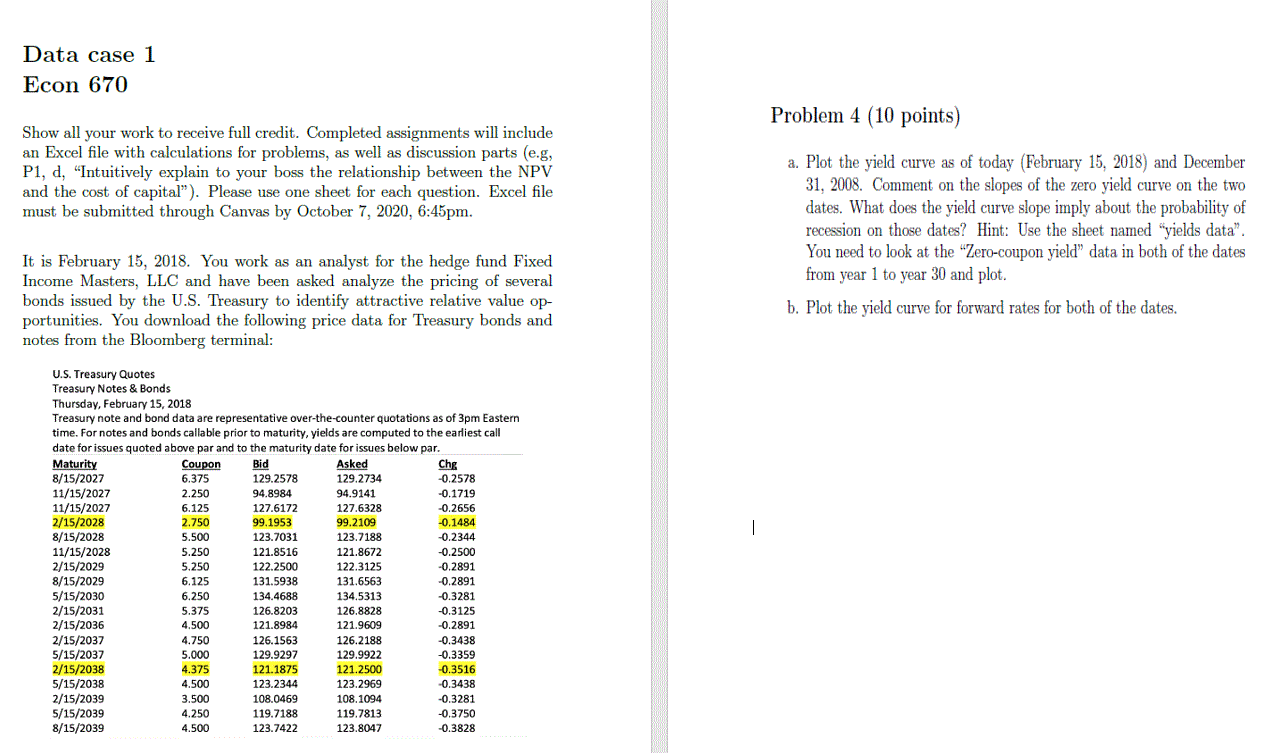
Data case 1 Econ 670 Problem 4 (10 points) Show all your work to receive full credit. Completed assignments will include an Excel file with calculations for problems, as well as discussion parts (e.g, P1, d, "Intuitively explain to your boss the relationship between the NPV and the cost of capital). Please use one sheet for each question. Excel file must be submitted through Canvas by October 7, 2020, 6:45pm. a. Plot the yield curve as of today (February 15, 2018) and December 31, 2008. Comment on the slopes of the zero yield curve on the two dates. What does the yield curve slope imply about the probability of recession on those dates? Hint: Use the sheet named "yields data". You need to look at the "Zero-coupon yield" data in both of the dates from year 1 to year 30 and plot. b. Plot the yield curve for forward rates for both of the dates. It is February 15, 2018. You work as an analyst for the hedge fund Fixed Income Masters, LLC and have been asked analyze the pricing of several bonds issued by the U.S. Treasury to identify attractive relative value op- portunities. You download the following price data for Treasury bonds and notes from the Bloomberg terminal: 2.250 1 U.S. Treasury Quotes Treasury Notes & Bonds Thursday, February 15, 2018 Treasury note and bond data are representative over-the-counter quotations as of 3pm Eastern time. For notes and bonds callable prior to maturity, yields are computed to the earliest call date for issues quoted above par and to the maturity date for issues below par. Maturity Coupon Bid Asked Chg 8/15/2027 6.375 129.2578 129.2734 -0.2578 11/15/2027 94.8984 94.9141 -0.1719 11/15/2027 6.125 127.6172 127.6328 -0.2656 2/15/2028 2.750 99.1953 99.2109 -0.1484 8/15/2028 5.500 123.7031 123.7188 -0.2344 11/15/2028 5.250 121.8516 121.8672 -0.2500 2/15/2029 5.250 122.2500 122.3125 -0.2891 8/15/2029 6.125 131.5938 131.6563 -0.2891 5/15/2030 6.250 134.4688 134.5313 -0.3281 2/15/2031 5.375 126.8203 126.8828 -0.3125 2/15/2036 4.500 121.8984 121.9609 -0.2891 2/15/2037 4.750 126.1563 126.2188 -0.3438 5/15/2037 5.000 129.9297 129.9922 -0.3359 2/15/2038 4.375 121.1875 121.2500 -0.3516 5/15/2038 4.500 123.2344 123.2969 -0.3438 2/15/2039 3.500 108.0469 108.1094 -0.3281 5/15/2039 4.250 119.7188 119.7813 -0.3750 8/15/2039 4.500 123.7422 123.8047 -0.3828 Data case 1 Econ 670 Problem 4 (10 points) Show all your work to receive full credit. Completed assignments will include an Excel file with calculations for problems, as well as discussion parts (e.g, P1, d, "Intuitively explain to your boss the relationship between the NPV and the cost of capital). Please use one sheet for each question. Excel file must be submitted through Canvas by October 7, 2020, 6:45pm. a. Plot the yield curve as of today (February 15, 2018) and December 31, 2008. Comment on the slopes of the zero yield curve on the two dates. What does the yield curve slope imply about the probability of recession on those dates? Hint: Use the sheet named "yields data". You need to look at the "Zero-coupon yield" data in both of the dates from year 1 to year 30 and plot. b. Plot the yield curve for forward rates for both of the dates. It is February 15, 2018. You work as an analyst for the hedge fund Fixed Income Masters, LLC and have been asked analyze the pricing of several bonds issued by the U.S. Treasury to identify attractive relative value op- portunities. You download the following price data for Treasury bonds and notes from the Bloomberg terminal: 2.250 1 U.S. Treasury Quotes Treasury Notes & Bonds Thursday, February 15, 2018 Treasury note and bond data are representative over-the-counter quotations as of 3pm Eastern time. For notes and bonds callable prior to maturity, yields are computed to the earliest call date for issues quoted above par and to the maturity date for issues below par. Maturity Coupon Bid Asked Chg 8/15/2027 6.375 129.2578 129.2734 -0.2578 11/15/2027 94.8984 94.9141 -0.1719 11/15/2027 6.125 127.6172 127.6328 -0.2656 2/15/2028 2.750 99.1953 99.2109 -0.1484 8/15/2028 5.500 123.7031 123.7188 -0.2344 11/15/2028 5.250 121.8516 121.8672 -0.2500 2/15/2029 5.250 122.2500 122.3125 -0.2891 8/15/2029 6.125 131.5938 131.6563 -0.2891 5/15/2030 6.250 134.4688 134.5313 -0.3281 2/15/2031 5.375 126.8203 126.8828 -0.3125 2/15/2036 4.500 121.8984 121.9609 -0.2891 2/15/2037 4.750 126.1563 126.2188 -0.3438 5/15/2037 5.000 129.9297 129.9922 -0.3359 2/15/2038 4.375 121.1875 121.2500 -0.3516 5/15/2038 4.500 123.2344 123.2969 -0.3438 2/15/2039 3.500 108.0469 108.1094 -0.3281 5/15/2039 4.250 119.7188 119.7813 -0.3750 8/15/2039 4.500 123.7422 123.8047 -0.3828
Step by Step Solution
There are 3 Steps involved in it

Get step-by-step solutions from verified subject matter experts