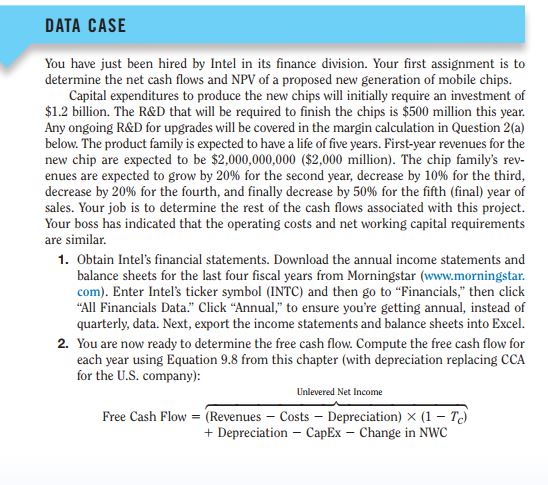
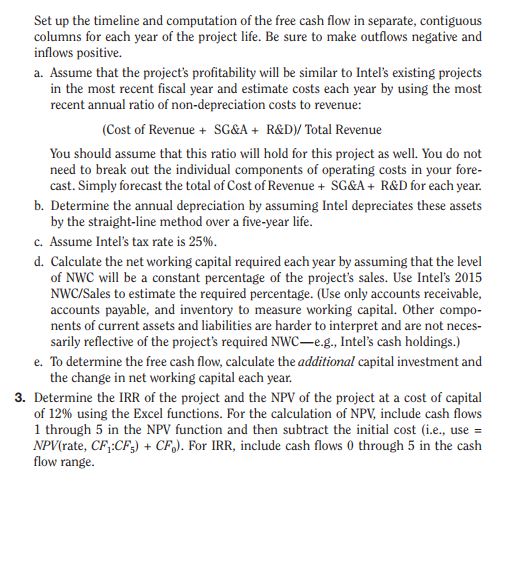
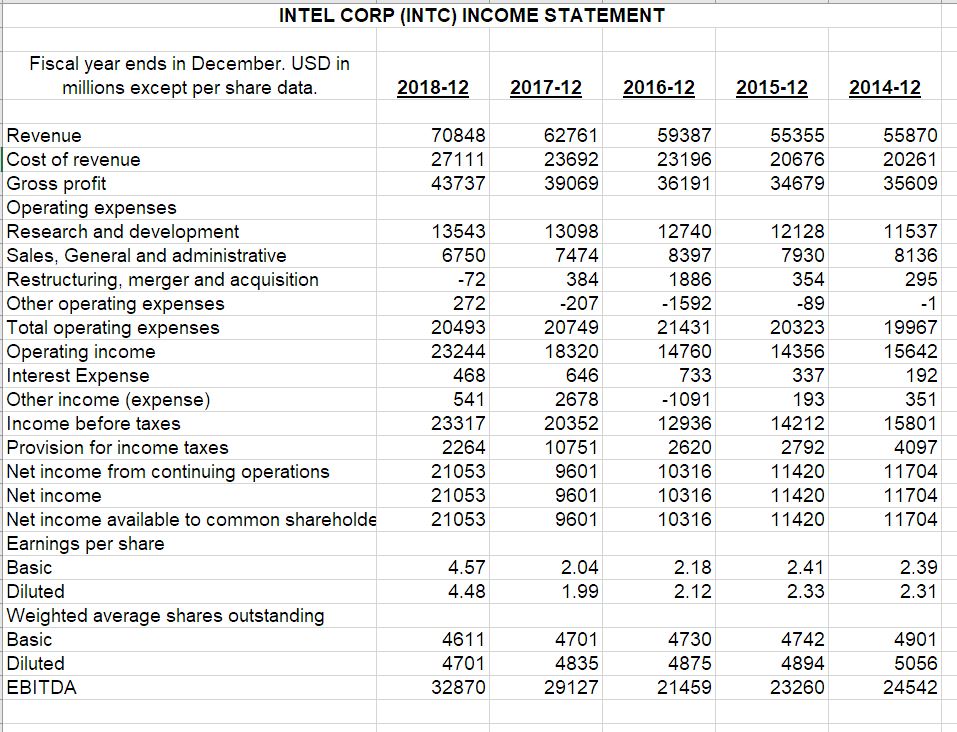
Question: DATA CASE You have just been hired by Intel in its finance division. Your first assignment is to determine the net cash flows and NPV

DATA CASE You have just been hired by Intel inDATA CASE You have just been hired by Intel inDATA CASE You have just been hired by Intel inDATA CASE You have just been hired by Intel inDATA CASE You have just been hired by Intel in
DATA CASE You have just been hired by Intel in its finance division. Your first assignment is to determine the net cash flows and NPV of a proposed new generation of mobile chips. Capital expenditures to produce the new chips will initially require an investment of $1.2 billion. The R&D that will be required to finish the chips is $500 million this year. Any ongoing R&D for upgrades will be covered in the margin calculation in Question 2(a) below. The product family is expected to have a life of five years. First-year revenues for the new chip are expected to be $2,000,000,000 ($2,000 million). The chip family's rev- enues are expected to grow by 20% for the second year, decrease by 10% for the third, decrease by 20% for the fourth, and finally decrease by 50% for the fifth (final) year of sales. Your job is to determine the rest of the cash flows associated with this project. Your boss has indicated that the operating costs and net working capital requirements are similar. 1. Obtain Intel's financial statements. Download the annual income statements and balance sheets for the last four fiscal years from Morningstar (www.morningstar. com). Enter Intel's ticker symbol (INTC) and then go to "Financials," then click "All Financials Data." Click "Annual," to ensure you're getting annual, instead of quarterly, data. Next, export the income statements and balance sheets into Excel. 2. You are now ready to determine the free cash flow. Compute the free cash flow for each year using Equation 9.8 from this chapter (with depreciation replacing CCA for the U.S. company): Unlevered Net Income Free Cash Flow = (Revenues - Costs - Depreciation) X (1 - T_) + Depreciation - CapEx - Change in NWCSet up the timeline and computation of the free cash ow in separate, contiguous columns for each year of the project life. Be sure to make outows negative and inows positive. a. Assume that die project's profitability will be similar to lntel's existing projects in the most recent scal year and estimate costs each year by using the most recent annual ratio of non-depreciation costs to revenue: [Cost of Revenue + SGML + HELD}! Total Revenue You should assume that this ratio will hold for this project as well. You do not need to break out the individual components of operating costs in your fore cast. Simply forecast the total of Cost of Revenue + SGML + [1er for each year. b. Determine the annual depreciation by assuming lntel depreciates these assets by the straight-line method over a five-year life. c. Assume Intel's tax rate is 25%. d. Calculate the net working capital required each year by assuming that the level of NM) will be a constant percentage of the project's sales. Use lntel*s 21115 NWCr'Sales to estimate the required percentage. [Use only accounts receivable, accounts payable. and inventory to measure working capital. Either compo- nents of current assets and liabilities are harder to interpret and are not neces- sarily reflective of the project's required NWEeg Intel's cash holdings} e. To determine the free cash ow, calculate the additional! capital investment and the change in net working capital each year. 3. Determine the [Hit of the proiect and the NF'ii of the project at a cost of capital of 12% using the Excel functions. For the calculation of bit-\"Ii: include cash ows 1 through 5 in the NW function and then subtract the initial cost ti.e.. use = h-lbl'trate. CF1:CF5I + CFD}. For lRR, include cash ows it through 5 in the cash ow range. INTEL CORP {INTO} mooms STATEMENT Fiscal year ends in December. USD in millions except per share data. 'Revenue Cost of revenue :Gross profit :Operating expenses Research and development .Sales. General and administrative Restructuring. merger and acquisition :Other operating expenses Total operating expenses Operating income _herestExpense :Other income (expense) income before taxes Provision for income taxes :Net income from continuing operations :Net income :Net income available to common shareholds Earnings per share Basic Diluted _Weighted average shares outstanding _Bamc Diluted _EBHDA 2018-12 70848 271 11 43737 13543 8750 -72 272 20493 23244 488 541 23317 2284 21053 21053 21053 4.57 4.48 4811 4701 32870 2017-12 82781 23892 39089 13098 7474 384 -207 20749 18320 848 2878 20352 10751 9801 9801 9801 2.04 1.99 4701 4835 29127 2018-12 59387 23198 38191 12740 8397 1888 -1592 21431 14780 733 -1091 12938 2820 10318 10318 10318 2.18 2.12 4730 4875 21459 2015-12 55355 20878 34879 12128 7930 354 -89 20323 14358 337 193 14212 2792 11420 11420 11420 2.41 2.33 4742 4894 23280 2014-12 55870 20281 35809 11537 8138 295 4 19987 15842 192 351 15801 4097 11704 11704 11704 2.39 2.31 4901 5058 24542 INTEL CORP (INTC) Statement of CASH FLOW Fiscal year ends in December. USD in millions except per share data. 2018-12 2017-12 2016-12 2015-12 2014-12 Cash Flows From Operating Activities Net income 21053 9601 10316 11420 11704 Depreciation & amortization 9085 8129 7790 8711 8549 Deferred income taxes -1749 1548 257 -1270 -703 Stock based compensation 1546 1358 1444 1305 1148 Change in working capital -421 3584 668 -1081 99 Accounts receivable -1714 -78 65 355 -861 Inventory 214 -1300 119 -764 -98 Prepaid expenses 1367 Accounts payable 211 191 182 -312 249 Other working capital -71 5474 302 350 1109 Other non-cash items -82 -2110 1333 -68 -181 Net cash provided by operating activities 29432 22110 21808 19017 20418 Cash Flows From Investing Activities Investments in property, plant, and equipment -15181 -11778 -9625 7326 -10105 Acquisitions, net 2286 -11375 -15470 -913 934 Purchases of investments -13346 18065 -22469 -21755 -22781 Sales/Maturities of investments 15274 24640 20413 21630 23336 Purchases of intangible -120 -92 Other investing activities -272 1334 301 671 Net cash used for investing activities -11239 -15762 -25817 -8183 -9905 Cash Flows From Financing Activities Debt issued 423 7716 2734 9476 Debt repayment 3026 8080 -1500 Common stock repurchased -10730 -3615 2587 -2676 -11117 Excess tax benefit from stock based compensation 121 159 122 Dividend paid -5541 -5072 4925 -4556 4409 Other financing activities 267 576 418 -491 1793 Net cash provided by (used for) financing activ -18607 8475 -5739 1912 13611 Effect of exchange rate changes -15 Net change in cash -414 -2127 9748 12747 -3113 Cash at beginning of period 3433 5560 15308 2561 5674 Cash at end of period 3019 3433 5560 15308 2561 Free Cash Flow Operating cash flow 29432 22110 21808 19017 20418 Capital expenditure -15181 -11778 -9625 -7446 -10197 Free cash flow 14251 10332 12183 11571 10221\f

Step by Step Solution

There are 3 Steps involved in it

1 Expert Approved Answer
Step: 1 Unlock blur-text-image
Question Has Been Solved by an Expert!

Get step-by-step solutions from verified subject matter experts

Step: 2 Unlock
Step: 3 Unlock

Students Have Also Explored These Related Finance Questions!