

Question: Data collected on the yearly registrations for a Six Sigma seminar at the Quality College are shown in the following table: begin{tabular}{lccccccccccc} hline Year &
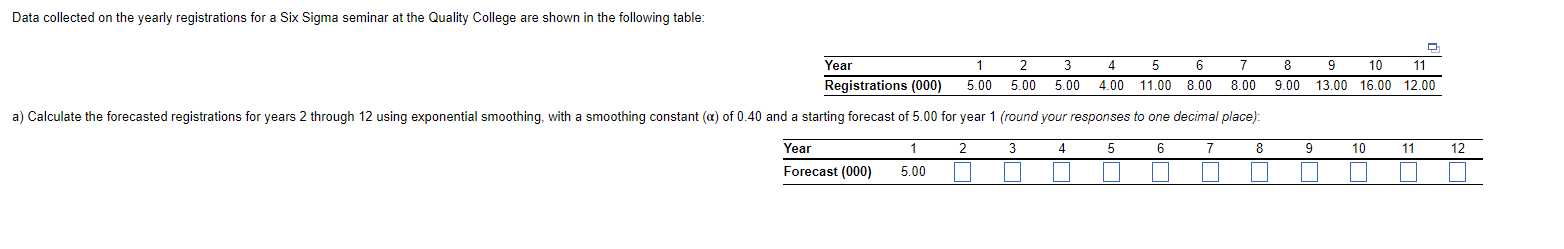
Data collected on the yearly registrations for a Six Sigma seminar at the Quality College are shown in the following table: \begin{tabular}{lccccccccccc} \hline Year & 1 & 2 & 3 & 4 & 5 & 6 & 7 & 8 & 9 & 10 & 11 \\ \hline Registrations (000) & 5.00 & 5.00 & 5.00 & 4.00 & 11.00 & 8.00 & 8.00 & 9.00 & 13.00 & 16.00 & 12.00 \\ \hline \end{tabular} \begin{tabular}{|c|c|c|c|c|c|c|c|c|c|c|c|c|} \hline Year & 1 & 2 & 3 & 4 & 5 & 6 & 7 & 8 & 9 & 10 & 11 & 12 \\ \hline Forecast (000) & 5.00 & & & & & & & & & & & \\ \hline \end{tabular}
Step by Step Solution
There are 3 Steps involved in it
1 Expert Approved Answer
Step: 1 Unlock

Question Has Been Solved by an Expert!
Get step-by-step solutions from verified subject matter experts
Step: 2 Unlock
Step: 3 Unlock