

Question: Data collected on the yearly registrations for an Operations Management short course at the Business College are shown in the following table: Year Sales
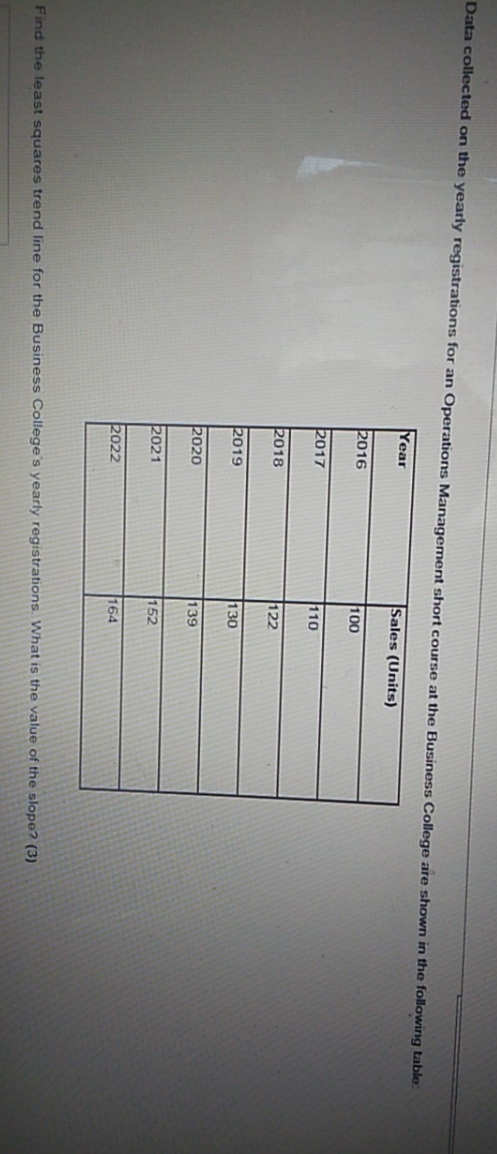
Data collected on the yearly registrations for an Operations Management short course at the Business College are shown in the following table: Year Sales (Units) 2016 100 2017 110 2018 122 2019 130 2020 139 2021 152 2022 164 Find the least squares trend line for the Business College's yearly registrations. What is the value of the slope? (3)
Step by Step Solution
There are 3 Steps involved in it
1 Expert Approved Answer
Step: 1 Unlock

Question Has Been Solved by an Expert!
Get step-by-step solutions from verified subject matter experts
Step: 2 Unlock
Step: 3 Unlock