

Question: Data Collection Clear all changes made to the simulation by clicking on the orange circled arrow in the bottom right corner. Setup your lab environment
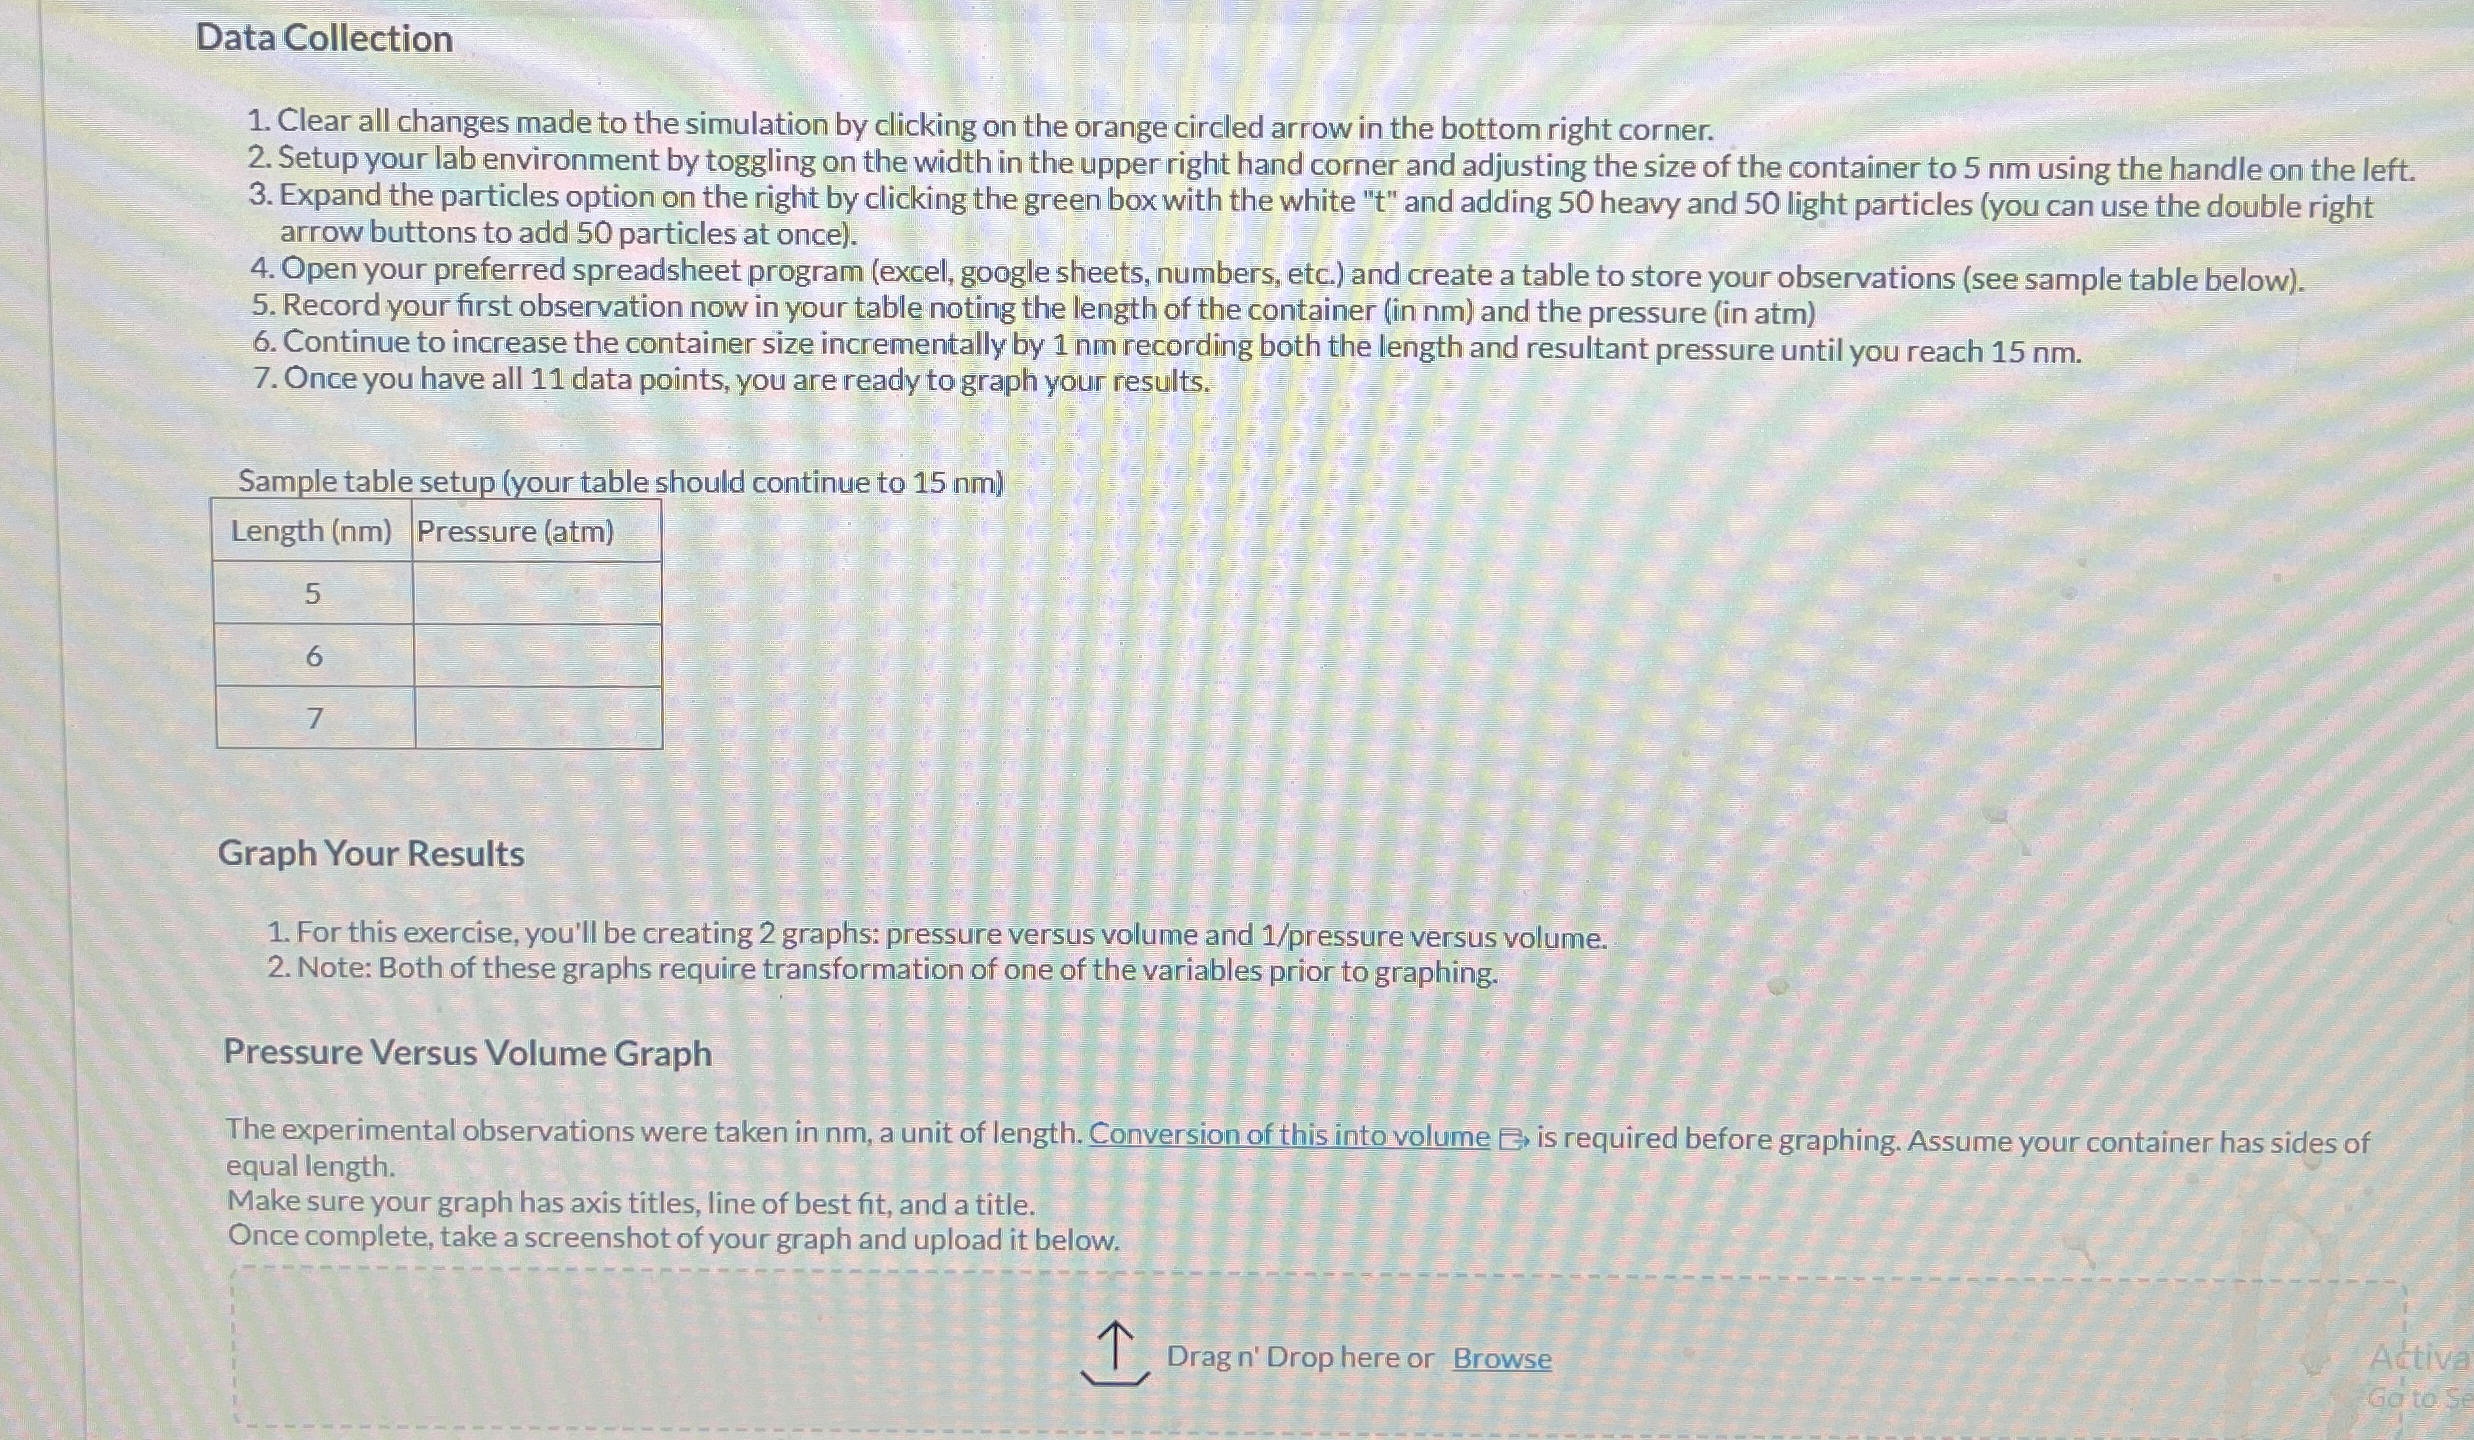
Data Collection
Clear all changes made to the simulation by clicking on the orange circled arrow in the bottom right corner.
Setup your lab environment by toggling on the width in the upper right hand corner and adjusting the size of the container to nm using the handle on the left.
Expand the particles option on the right by clicking the green box with the white and adding heavy and light particles you can use the double right arrow buttons to add particles at once
Open your preferred spreadsheet program excel google sheets, numbers, etc. and create a table to store your observations see sample table below
Record your first observation now in your table noting the length of the container in nm and the pressure in atm
Continue to increase the container size incrementally by nm recording both the length and resultant pressure until you reach nm
Once you have all data points, you are ready to graph your results.
Sample table setup your table should continue to nm
tableLength nmPressure atm
Graph Your Results
For this exercise, you'll be creating graphs: pressure versus volume and pressure versus volume.
Note: Both of these graphs require transformation of one of the variables prior to graphing.
Pressure Versus Volume Graph
The experimental observations were taken in nm a unit of length. Conversion of this into volume is required before graphing. Assume your container has sides of equal length.
Make sure your graph has axis titles, line of best fit, and a title.
Once complete, take a screenshot of your graph and upload it below.
Dragn' Drop here or Browse
Step by Step Solution
There are 3 Steps involved in it
1 Expert Approved Answer
Step: 1 Unlock

Question Has Been Solved by an Expert!
Get step-by-step solutions from verified subject matter experts
Step: 2 Unlock
Step: 3 Unlock