

Question: Data- Complete the following table. Note: When entering intermediate calculations, round to two decimal places, but do not round the intermediate calculations when determining final
Data-
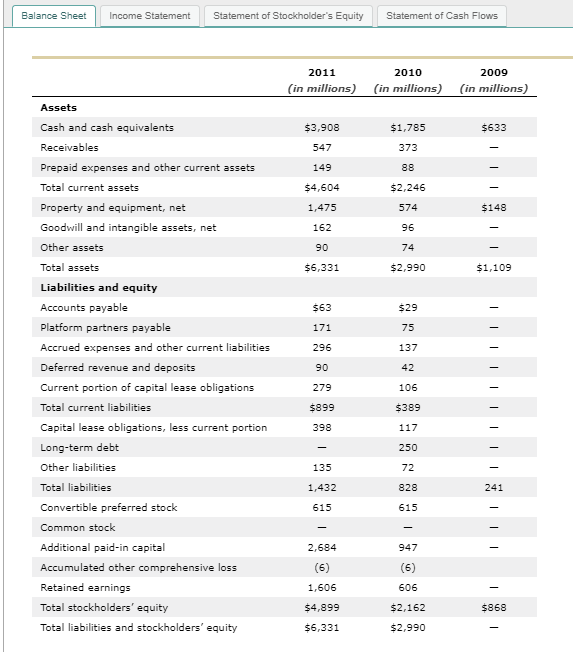
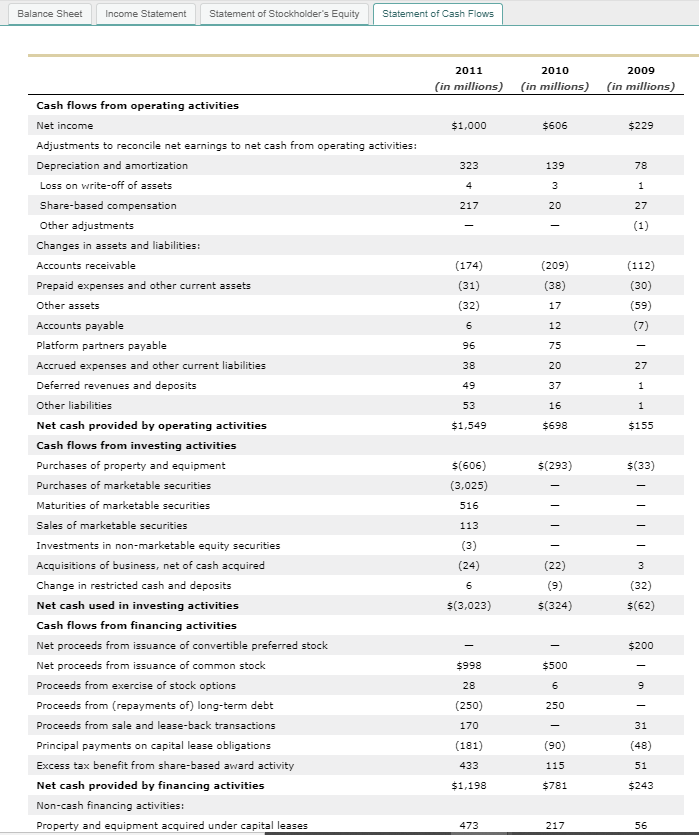
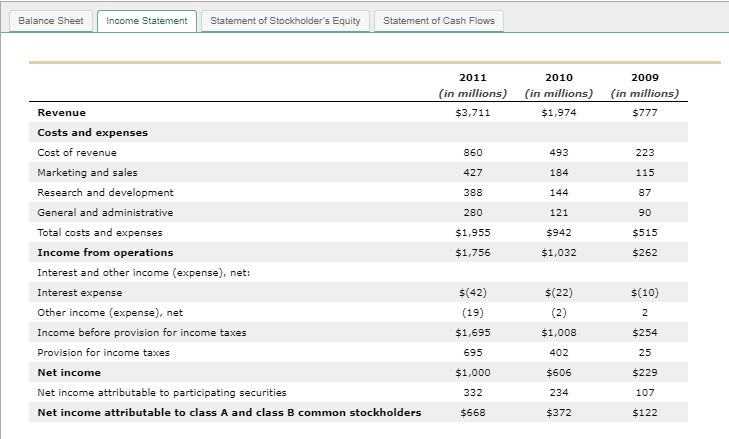
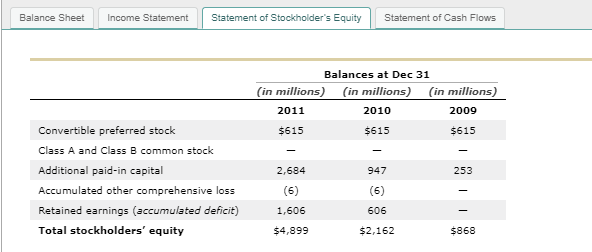
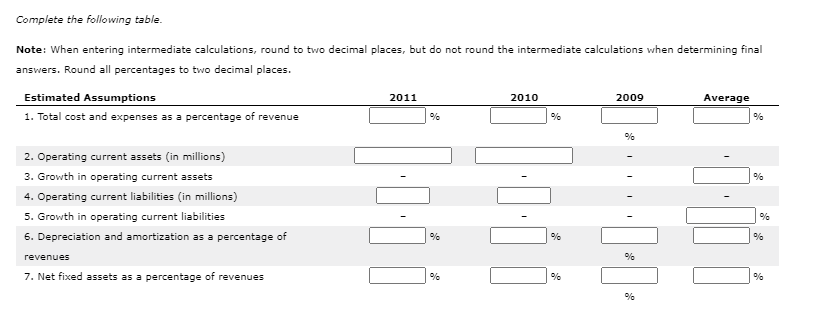
Complete the following table. Note: When entering intermediate calculations, round to two decimal places, but do not round the intermediate calculations when determining final answers. Round all percentages to two decimal places. 2011 2010 2009 Estimated Assumptions 1. Total cost and expenses as a percentage of revenue Average % % 2. Operating current assets (in millions) 3. Growth in operating current assets 4. Operating current liabilities (in millions) 5. Growth in operating current liabilities 6. Depreciation and amortization as a percentage of 1206 % % % revenues 1:1 % 7. Net fixed assets as a percentage of revenues % % % Balance Sheet Income Statement Statement of Stockholder's Equity Statement of Cash Flows 2011 2010 (in millions) (in millions) 2009 (in millions) Assets $3,908 $1,785 $633 547 373 149 88 $4,604 $2,246 1,475 574 $148 162 96 - - 90 74 $6,331 $2,990 $1,109 $63 $29 171 75 296 137 90 42 Cash and cash equivalents Receivables Prepaid expenses and other current assets Total current assets Property and equipment, net Goodwill and intangible assets, net Other assets Total assets Liabilities and equity Accounts payable Platform partners payable Accrued expenses and other current liabilities Deferred revenue and deposits Current portion of capital lease obligations Total current liabilities Capital lease obligations, less current portion Long-term debt Other liabilities Total liabilities Convertible preferred stock Common stock Additional paid-in capital Accumulated other comprehensive loss Retained earnings Total stockholders' equity Total liabilities and stockholders' equity 279 106 $899 $389 398 117 250 135 72 1,432 828 241 615 615 2,684 947 - 1,606 606 $4,899 $2,162 $868 $6,331 - $2,990 Balance Sheet Income Statement Statement of Stockholder's Equity Statement of Cash Flows 2011 (in millions) 2010 (in millions) 2009 (in millions) $1,000 $606 $229 323 139 78 4 3 1 217 20 27 (1) (209) (38) (174) (31) (32) 6 (112) (30) (59) (7) 17 12 96 75 38 20 27 49 37 1 53 16 1 $1,549 $698 $155 Cash flows from operating activities Net income Adjustments to reconcile net earnings to net cash from operating activities: Depreciation and amortization Loss on write-off of assets Share-based compensation Other adjustments Changes in assets and liabilities: Accounts receivable Prepaid expenses and other current assets Other assets Accounts payable Platform partners payable Accrued expenses and other current liabilities Deferred revenues and deposits Other liabilities Net cash provided by operating activities Cash flows from investing activities Purchases of property and equipment Purchases of marketable securities Maturities of marketable securities Sales of marketable securities Investments in non-marketable equity securities Acquisitions of business, net of cash acquired Change in restricted cash and deposits Net cash used in investing activities Cash flows from financing activities Net proceeds from issuance of convertible preferred stock Net proceeds from issuance of common stock Proceeds from exercise of stock options Proceeds from (repayments of) long-term debt Proceeds from sale and lease-back transactions Principal payments on capital lease obligations Excess tax benefit from share-based award activity Net cash provided by financing activities Non-cash financing activities: Property and equipment acquired under capital leases $(293) $(33) $(606) (3,025) 516 113 (3) (24) 3 6 (22) (9) $(324) (32) $(62) $(3,023) $200 $998 $500 28 6 9 250 (250) 170 31 (181) (48) (90) 115 433 51 $1,198 $781 $243 473 217 56 Balance Sheet Income Statement Statement of Stockholder's Equity Statement of Cash Flows 2011 (in millions) $3,711 2010 (in millions) $1,974 2009 (in millions) $777 860 493 223 427 184 115 388 144 87 280 121 90 $1,955 $942 $515 $1,756 $1,032 $262 Revenue Costs and expenses Cost of revenue Marketing and sales Research and development General and administrative Total costs and expenses Income from operations Interest and other income (expense), net: Interest expense Other income (expense), net Income before provision for income taxes Provision for income taxes Net income Net income attributable to participating securities Net income attributable to class A and class B common stockholders $(42) (19) $(22) (2) $1,008 $(10) 2 $1,695 $254 695 402 25 $1,000 $606 $229 332 234 107 $668 $372 $122 Balance Sheet Income Statement Statement of Stockholder's Equity Statement of Cash Flows Balances at Dec 31 (in millions) (in millions) (in millions) 2010 2009 2011 $615 $615 $615 2,684 947 253 Convertible preferred stock Class A and Class B common stock Additional paid-in capital Accumulated other comprehensive loss Retained earnings (accumulated deficit) Total stockholders' equity (6) (6) 1,606 606 $4,899 $2,162 $868
Step by Step Solution
There are 3 Steps involved in it

Get step-by-step solutions from verified subject matter experts