

Question: Data covering the most recent 3 0 days are given in the following table for the price per gallon of regular gasoline at a local
Data covering the most recent days are given in the following table for the price per gallon of regular gasoline at a local station.
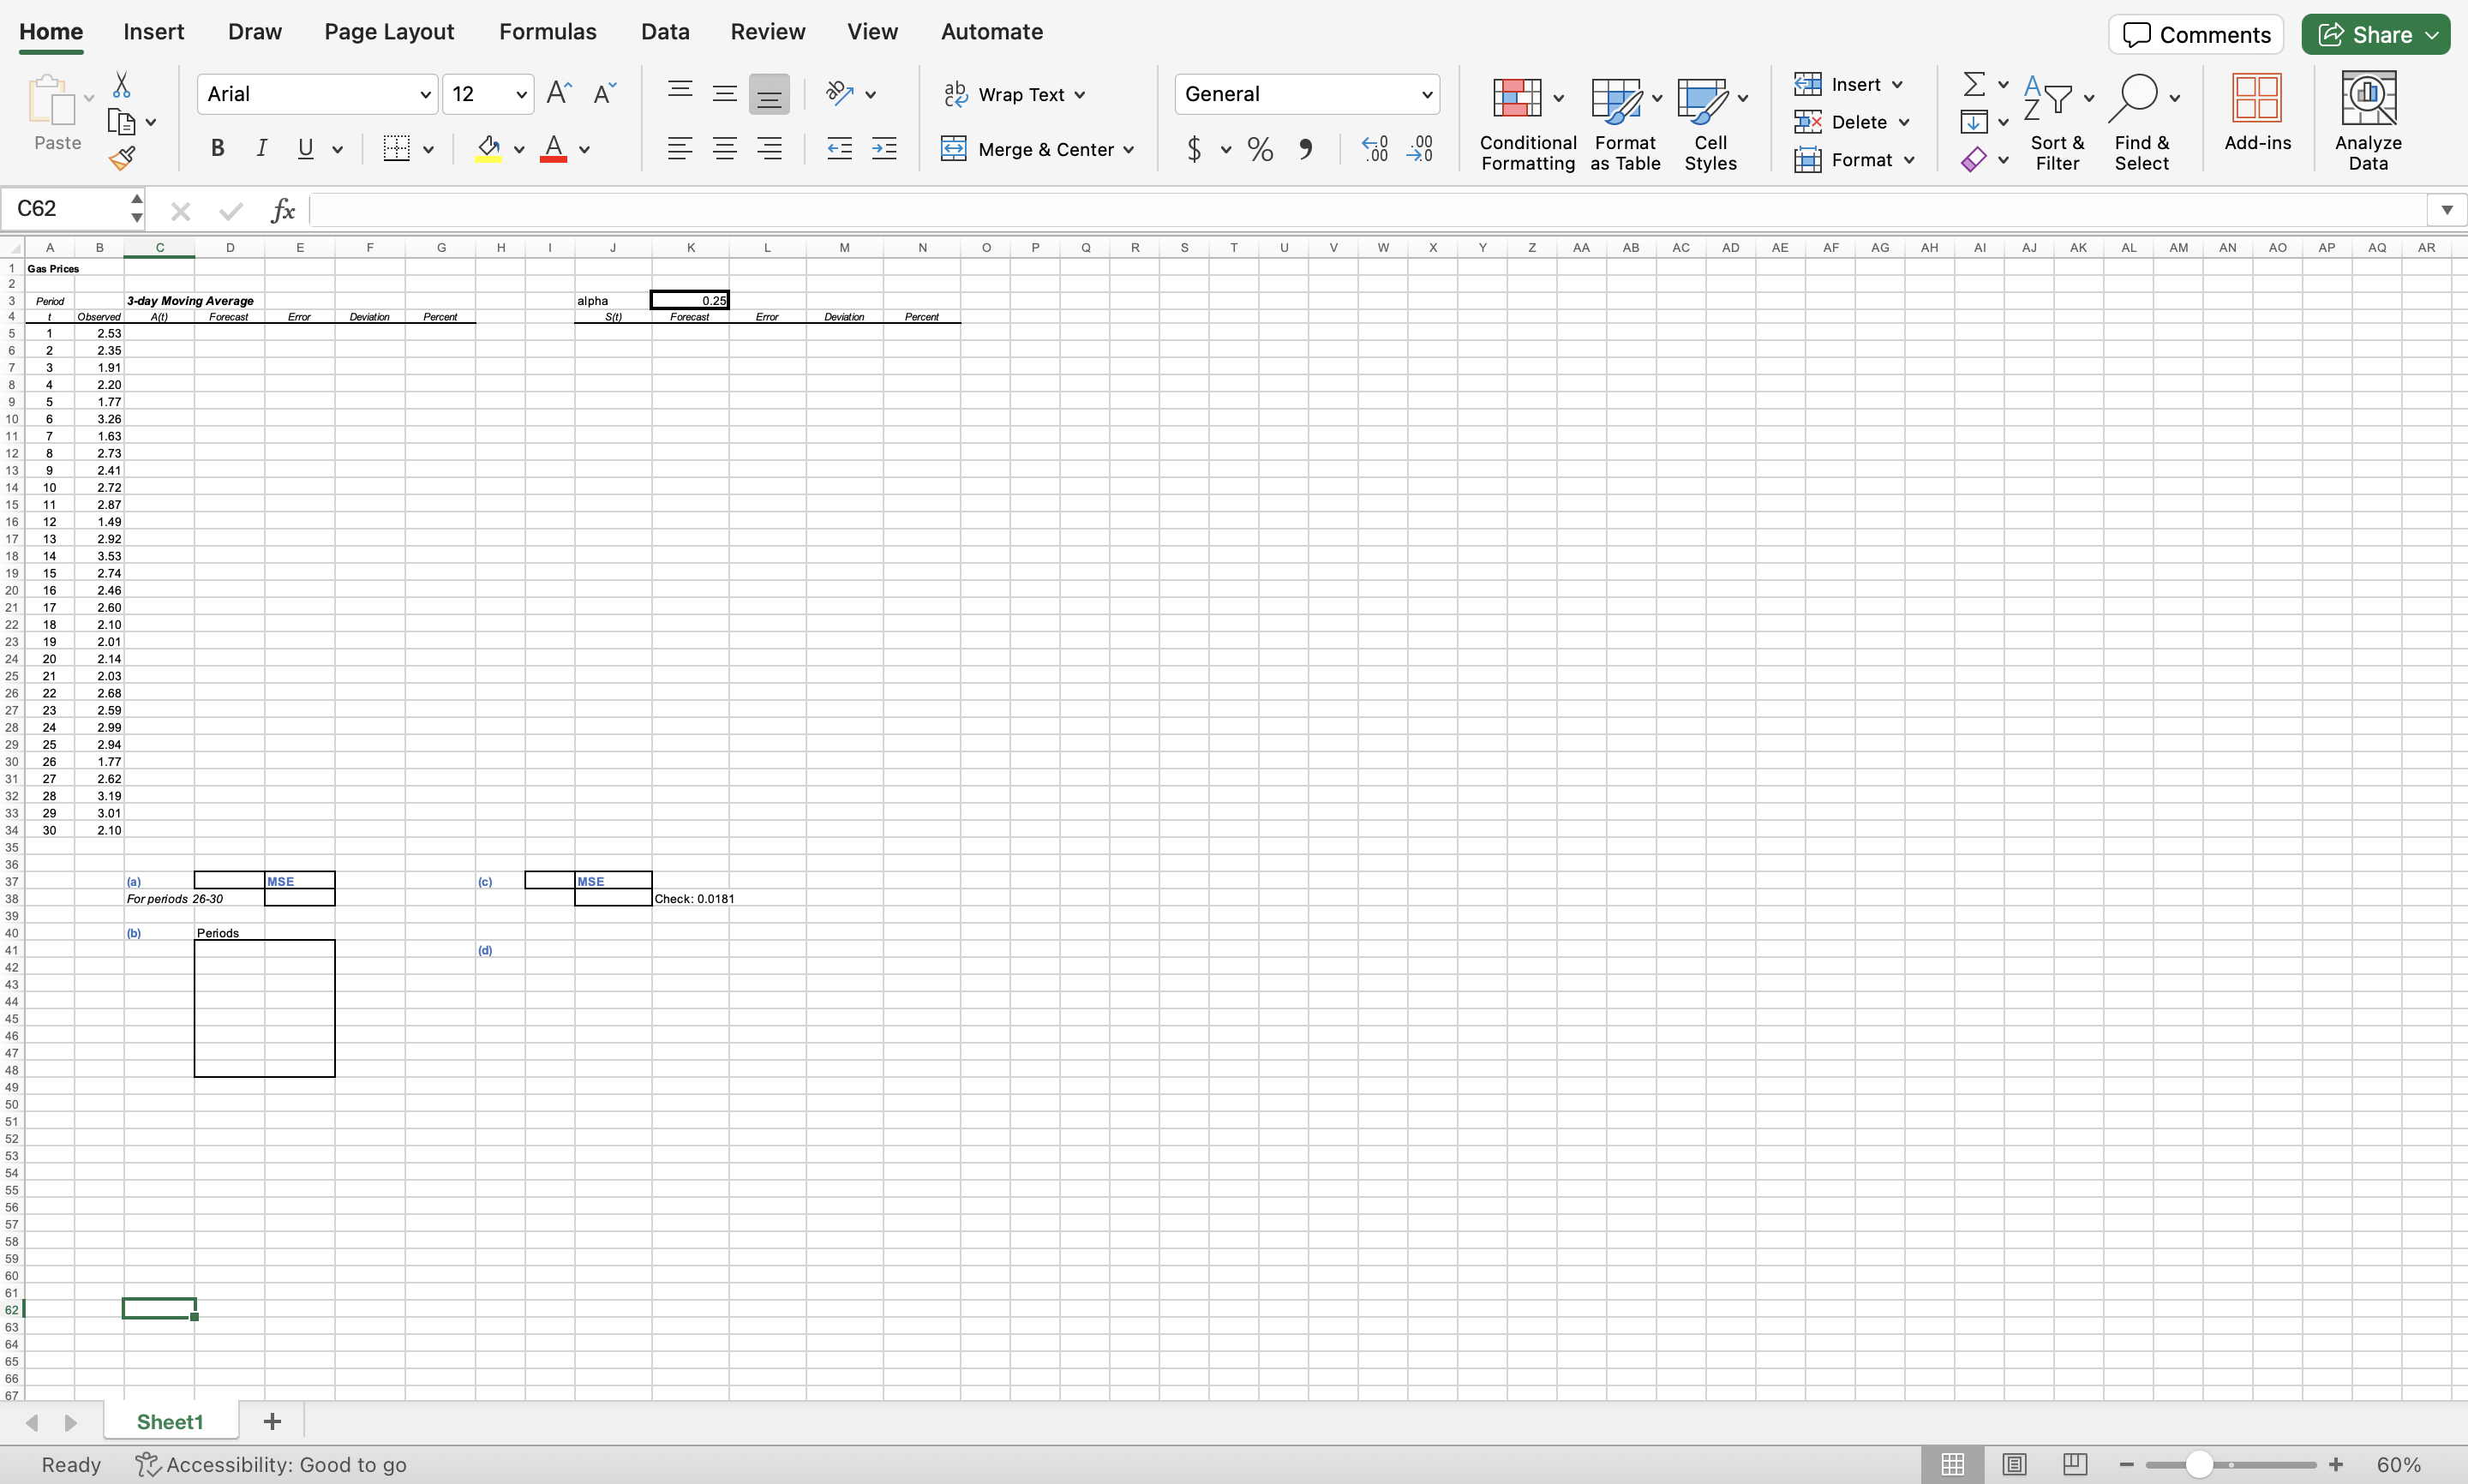
Day Price Day Price
aCompute a forecast for the next day's price by using a day moving average. What is the forecast? What is the MSE for the last five observations?
bCan you reduce the MSE for the last five observations by changing the movingaverage window? Try to day windows.
c Compute a forecast for the next day's price by using exponential smoothing with a What is the forecast? What is the MSE for the last five
observations?
dCan you improve the MSE for the last five observations by changing the smoothing constant a
Step by Step Solution
There are 3 Steps involved in it
1 Expert Approved Answer
Step: 1 Unlock

Question Has Been Solved by an Expert!
Get step-by-step solutions from verified subject matter experts
Step: 2 Unlock
Step: 3 Unlock