

Question: Data: Dr. Z divides her clients with depression into 2 groups. She asks Group 1 not to watch or read any news for two weeks
Data: Dr. Z divides her clients with depression into 2 groups. She asks Group 1 not to watch or read any news for two weeks while in therapy and asks Group 2 to continue with therapy as normal. The groups scored the following on measure of depression:
Measure of Depression:
Group 1: 34, 25, 4, 64, 14, 49, 54
Group 2: 24, 78, 59, 68, 84, 79, 57
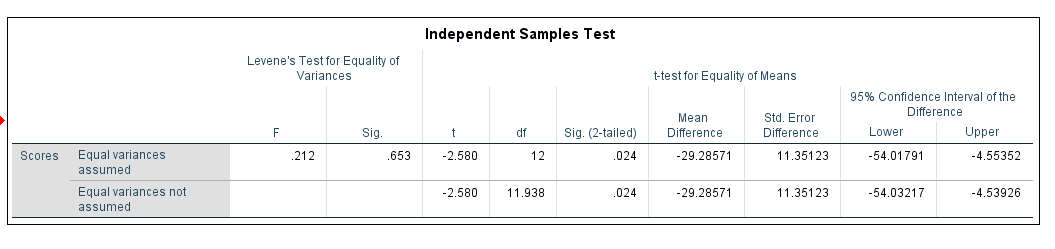
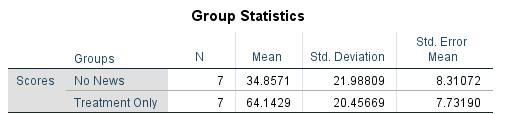
Independent Samples Test Levene's Test for Equality of Variances t-test for Equality of Means 95% Confidence Interval of the Mean Std. Error Difference F Sig. df Sig. (2-tailed) Difference Difference Lower Upper Scores Equal variances 212 653 -2.580 12 024 29.28571 11.35123 54.01791 -4.55352 assumed Equal variances not -2.580 11.938 024 -29.28571 11.35123 -54.03217 -4.53926 assumedGroup Statistics Std. Error Groups N Mean Std. Deviation Mean Scores No News 7 34.8571 21.98809 8.31072 Treatment Only 7 64.1429 20.45669 7.73190
Step by Step Solution
There are 3 Steps involved in it

Get step-by-step solutions from verified subject matter experts