

Question: DATA: ezto.mheducation.com Files M Question 9 - HW # 4 (Forecasting) - Connect M MHE Reader Course Hero Check my work mode : This shows
DATA:
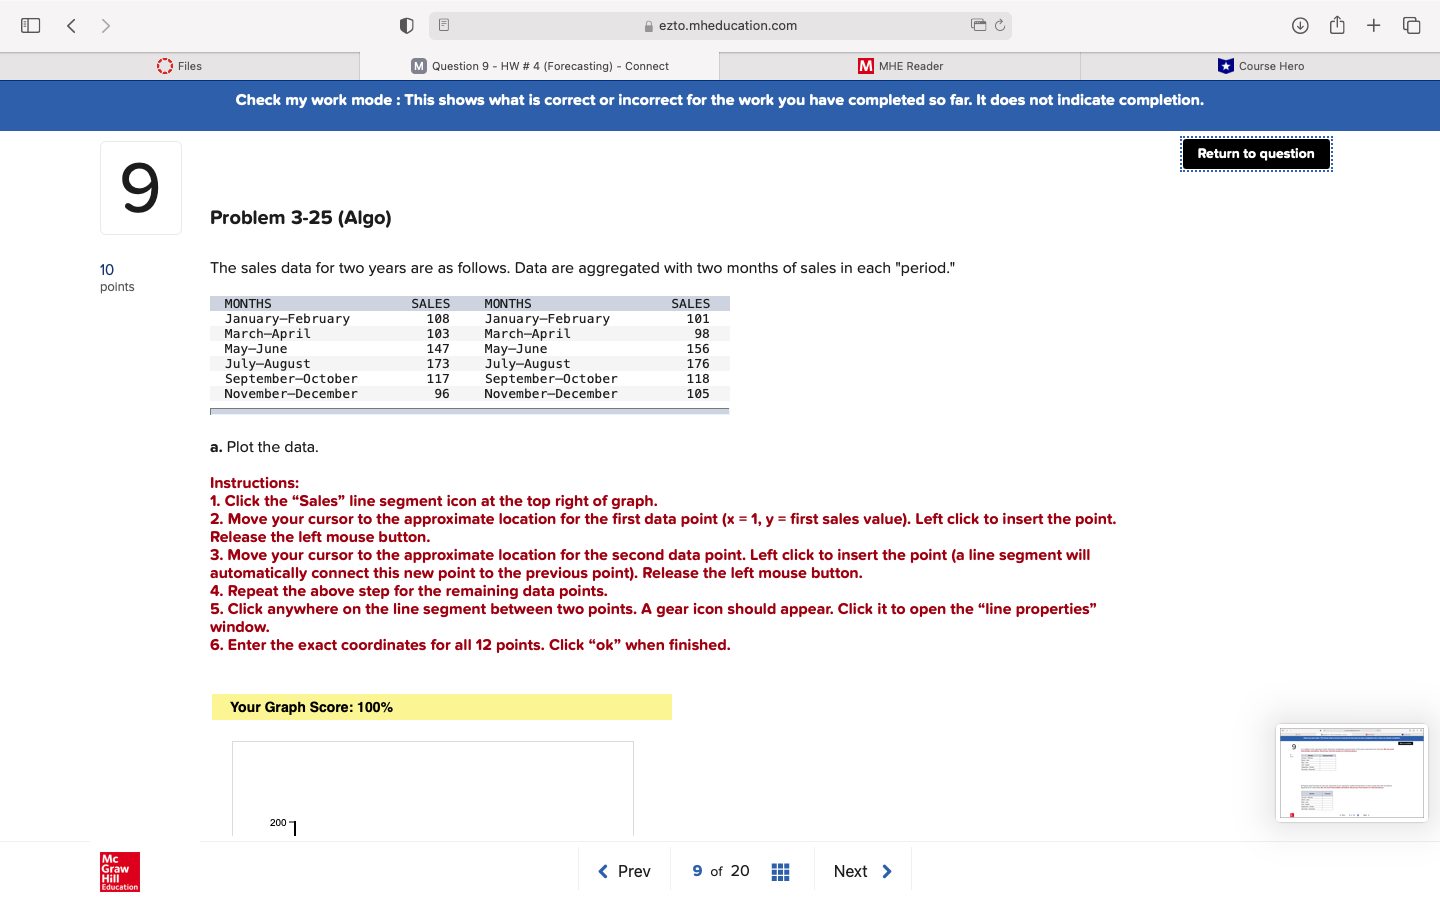
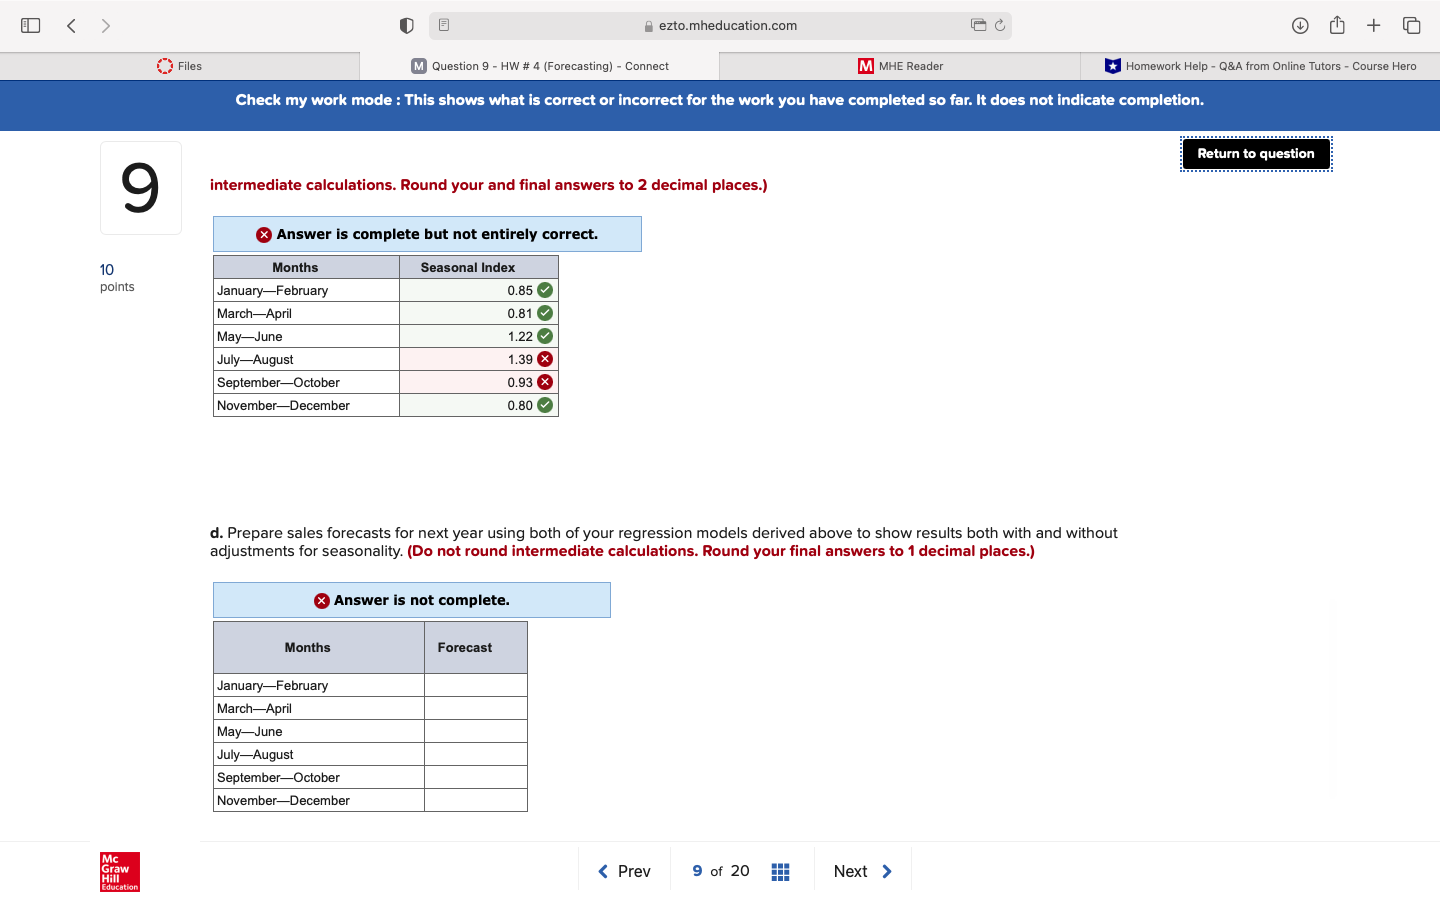
ezto.mheducation.com Files M Question 9 - HW # 4 (Forecasting) - Connect M MHE Reader Course Hero Check my work mode : This shows what is correct or incorrect for the work you have completed so far. It does not indicate completion. Return to question 9 Problem 3-25 (Algo) 10 The sales data for two years are as follows. Data are aggregated with two months of sales in each "period." points MONTHS SALES MONTHS SALES January-February 108 January-February 101 March-April 103 March-April 98 May-June 147 May-June 156 July-August 173 July-August 176 September-October 117 September-October 118 November-December 96 November-December 105 a. Plot the data. Instructions: 1. Click the "Sales" line segment icon at the top right of graph. 2. Move your cursor to the approximate location for the first data point (x = 1, y = first sales value). Left click to insert the point. Release the left mouse button. 3. Move your cursor to the approximate location for the second data point. Left click to insert the point (a line segment will automatically connect this new point to the previous point). Release the left mouse button. 4. Repeat the above step for the remaining data points. 5. Click anywhere on the line segment between two points. A gear icon should appear. Click it to open the "line properties" window. 6. Enter the exact coordinates for all 12 points. Click "ok" when finished. Your Graph Score: 100% 200 Mc Graw Education ezto.mheducation.com + Files M Question 9 - HW # 4 (Forecasting) - Connect M MHE Reader Homework Help - Q&A from Online Tutors - Course Hero Check my work mode : This shows what is correct or incorrect for the work you have completed so far. It does not indicate completion. Return to question 9 intermediate calculations. Round your and final answers to 2 decimal places.) x Answer is complete but not entirely correct. 10 Months Seasonal Index points January-February 0.85 March-April 0.81 May-June 1.22 July-Augus 1.39 X September-October 0.93 X November-December 0.80 d. Prepare sales forecasts for next year using both of your regression models derived above to show results both with and without adjustments for seasonality. (Do not round intermediate calculations. Round your final answers to 1 decimal places.) x Answer is not complete. Months Forecast January-February March-April May-June July-August September-October November-December Mc Graw ducation
Step by Step Solution
There are 3 Steps involved in it

Get step-by-step solutions from verified subject matter experts