

Question: Data file (A6DATA.csv): https://www.dropbox.com/s/gxa0yf2j7mnp1x4/A6DATA.csv?dl=0 V1: variance of Wavelet Transformed image (continuous) V2: skewness of Wavelet Transformed image (continuous) V3: kurtosis of Wavelet Transformed image (continuous)
Data file (A6DATA.csv): https://www.dropbox.com/s/gxa0yf2j7mnp1x4/A6DATA.csv?dl=0
V1: variance of Wavelet Transformed image (continuous)
V2: skewness of Wavelet Transformed image (continuous)
V3: kurtosis of Wavelet Transformed image (continuous)
V4: entropy of image (continuous)
V5: class (0-forged, 1-genuine)
Part 1:
Read the A6DATA.csv data file into RStudio. Then, Run set.seed(222) for partitioning of the dataset into training (50%) andtesting (50%). Report on the number of forged and genuine banknote-like specimens in the training and testing data.
Part 2:
Assemble logistic regression models with 60%/40%, 70%/30%, and 80%/20% partitioning into training and testing data sets using set.seed(222). Summarize the training and testing accuracy, sensitivity and specificity for each and compare with 50%/50% performance using the table below. Please recommend and comment on the best model.
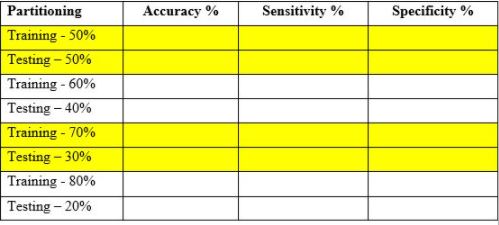
Partitioning Accuracy % Sensitivity % Specificity % Training - 50% Testing - 50% ing - 60% Training Testing - 40% Training - 70% Testing - 30% Training - 80% Testing - 20%
Step by Step Solution
There are 3 Steps involved in it

Get step-by-step solutions from verified subject matter experts