Question: Data File (Excel): Given this data, what statistical question(s) would you ask? How would it help you? When trying to decide what car to buy,
Data File (Excel):
- Given this data, what statistical question(s) would you ask? How would it help you?
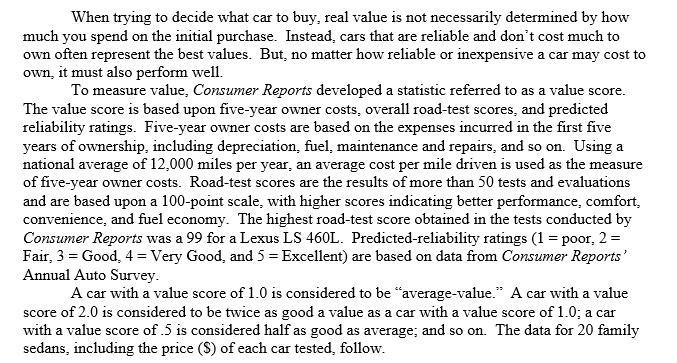
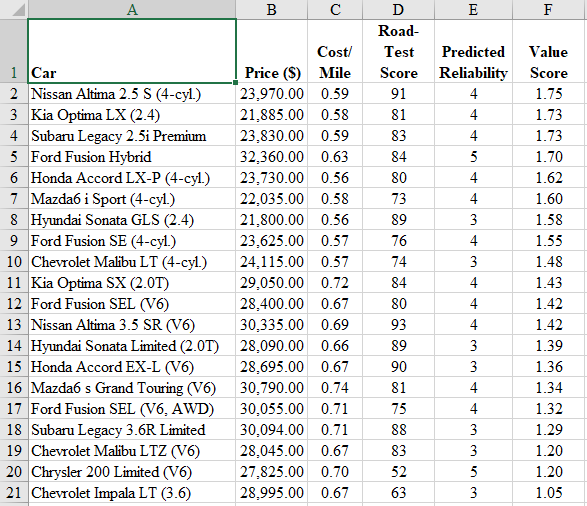
When trying to decide what car to buy, real value is not necessarily determined by how much you spend on the initial purchase. Instead, cars that are reliable and don't cost much to own often represent the best values. But, no matter how reliable or inexpensive a car may cost to own it must also perform well. To measure value, Consumer Reports developed a statistic referred to as a value score. The value score is based upon five-year owner costs, overall road-test scores, and predicted reliability ratings. Five-year owner costs are based on the expenses incurred in the first five years of ownership, including depreciation, fuel, maintenance and repairs, and so on. Using a national average of 12,000 miles per year, an average cost per mile driven is used as the measure of five-year owner costs. Road-test scores are the results of more than 50 tests and evaluations and are based upon a 100-point scale, with higher scores indicating better performance, comfort, convenience, and fuel economy. The highest road-test score obtained in the tests conducted by Consumer Reports was a 99 for a Lexus LS 460L. Predicted-reliability ratings (1 = poor, 2 = Fair, 3 = Good. 4 = Very Good, and 5 = Excellent) are based on data from Consumer Reports' Annual Auto Survey. A car with a value score of 1.0 is considered to be average-value. A car with a value score of 2.0 is considered to be twice as good a value as a car with a value score of 1.0; a car with a value score of 5 is considered half as good as average; and so on. The data for 20 family sedans, including the price (S) of each car tested, follow. A B F Cost/ 1 Car Price ($) Mile 2 Nissan Altima 2.5 S (4-cyl.) 23,970.00 0.59 3 Kia Optima LX (2.4) 21,885.00 0.58 4 Subaru Legacy 2.5i Premium 23,830.00 0.59 5 Ford Fusion Hybrid 32,360.00 0.63 6 Honda Accord LX-P (4-cyl.) 23,730.00 0.56 7 Mazda6 i Sport (4-cyl.) 22.035.00 0.58 8 Hyundai Sonata GLS (2.4) 21,800.00 0.56 9 Ford Fusion SE (4-cyl.) 23,625.00 0.57 10 Chevrolet Malibu LT (4-cyl.) 24.115.00 0.57 11 Kia Optima SX (2.0T) 29,050.00 0.72 12 Ford Fusion SEL (V6) 28,400.00 0.67 13 Nissan Altima 3.5 SR (16) 30,335.00 0.69 14 Hyundai Sonata Limited (2.0T) 28.090.00 0.66 15 Honda Accord EX-L (16) 28,695.00 0.67 16 Mazda6 s Grand Touring (V6) 30,790.00 0.74 17 Ford Fusion SEL (V6, AWD) 30.055.00 0.71 18 Subaru Legacy 3.6 Limited 30.094.00 0.71 19 Chevrolet Malibu LTZ (V6) 28.045.00 0.67 20 Chrysler 200 Limited (16) 27.825.00 0.70 21 Chevrolet Impala LT (3.6) 28,995.00 0.67 D E Road- Test Predicted Score Reliability 91 4 81 4 83 4 84 5 80 4 73 4 89 3 76 4 74 3 84 4 80 4 93 4 89 3 90 3 81 4 75 4 88 3 83 3 52 5 63 3 Value Score 1.75 1.73 1.73 1.70 1.62 1.60 1.58 1.55 1.48 1.43 1.42 1.42 1.39 1.36 1.34 1.32 1.29 1.20 1.20 1.05


