

Question: Data file Problem 1: T-test for single population using R language T-test Calculate mean, stdev, Sx-bar using R language Check the Hypothesis (below) for Alpha

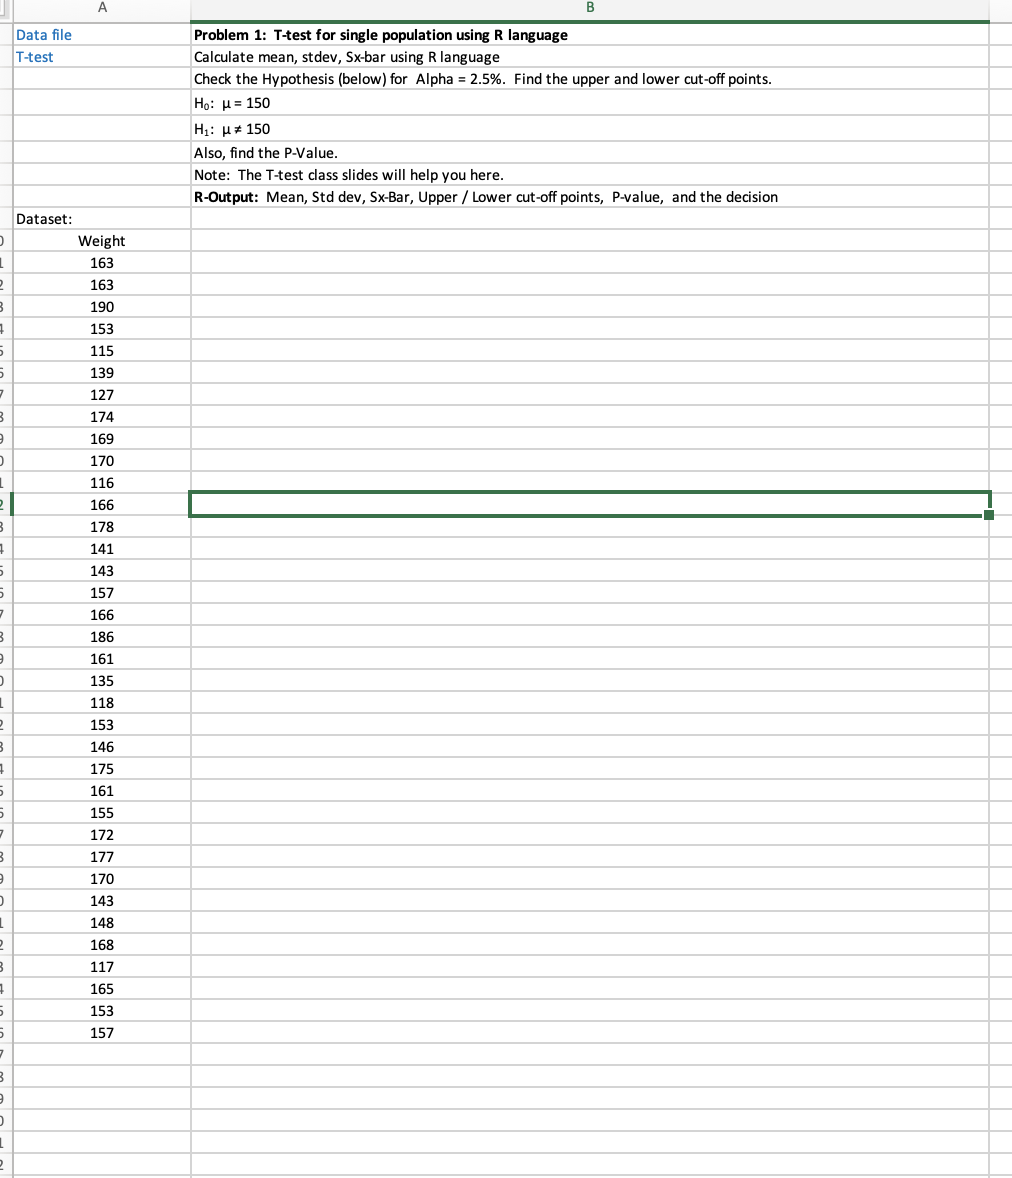
Data file Problem 1: T-test for single population using R language T-test Calculate mean, stdev, Sx-bar using R language Check the Hypothesis (below) for Alpha = 2.5%. Find the upper and lower cut-off points. Ho: H = 150 H1: H # 150 Also, find the P-Value. Note: The T-test class slides will help you here. R-Output: Mean, Std dev, Sx-Bar, Upper / Lower cut-off points, P-value, and the decision Dataset: Weight 163 163 190 153 115 139 127 174 169 170 116 166 178 141 143 157 166 186 161 135 118 153 146 175 161 155 172 177 170 143 148 168 117 165 153 157
Step by Step Solution
There are 3 Steps involved in it
1 Expert Approved Answer
Step: 1 Unlock

Question Has Been Solved by an Expert!
Get step-by-step solutions from verified subject matter experts
Step: 2 Unlock
Step: 3 Unlock