

Question: data: Find the mean, variance, and standard deviation for the following sample Cholesterol levels Frequency| midpoint (x) L2 L1 100-130 25 2575 131-161 68 146

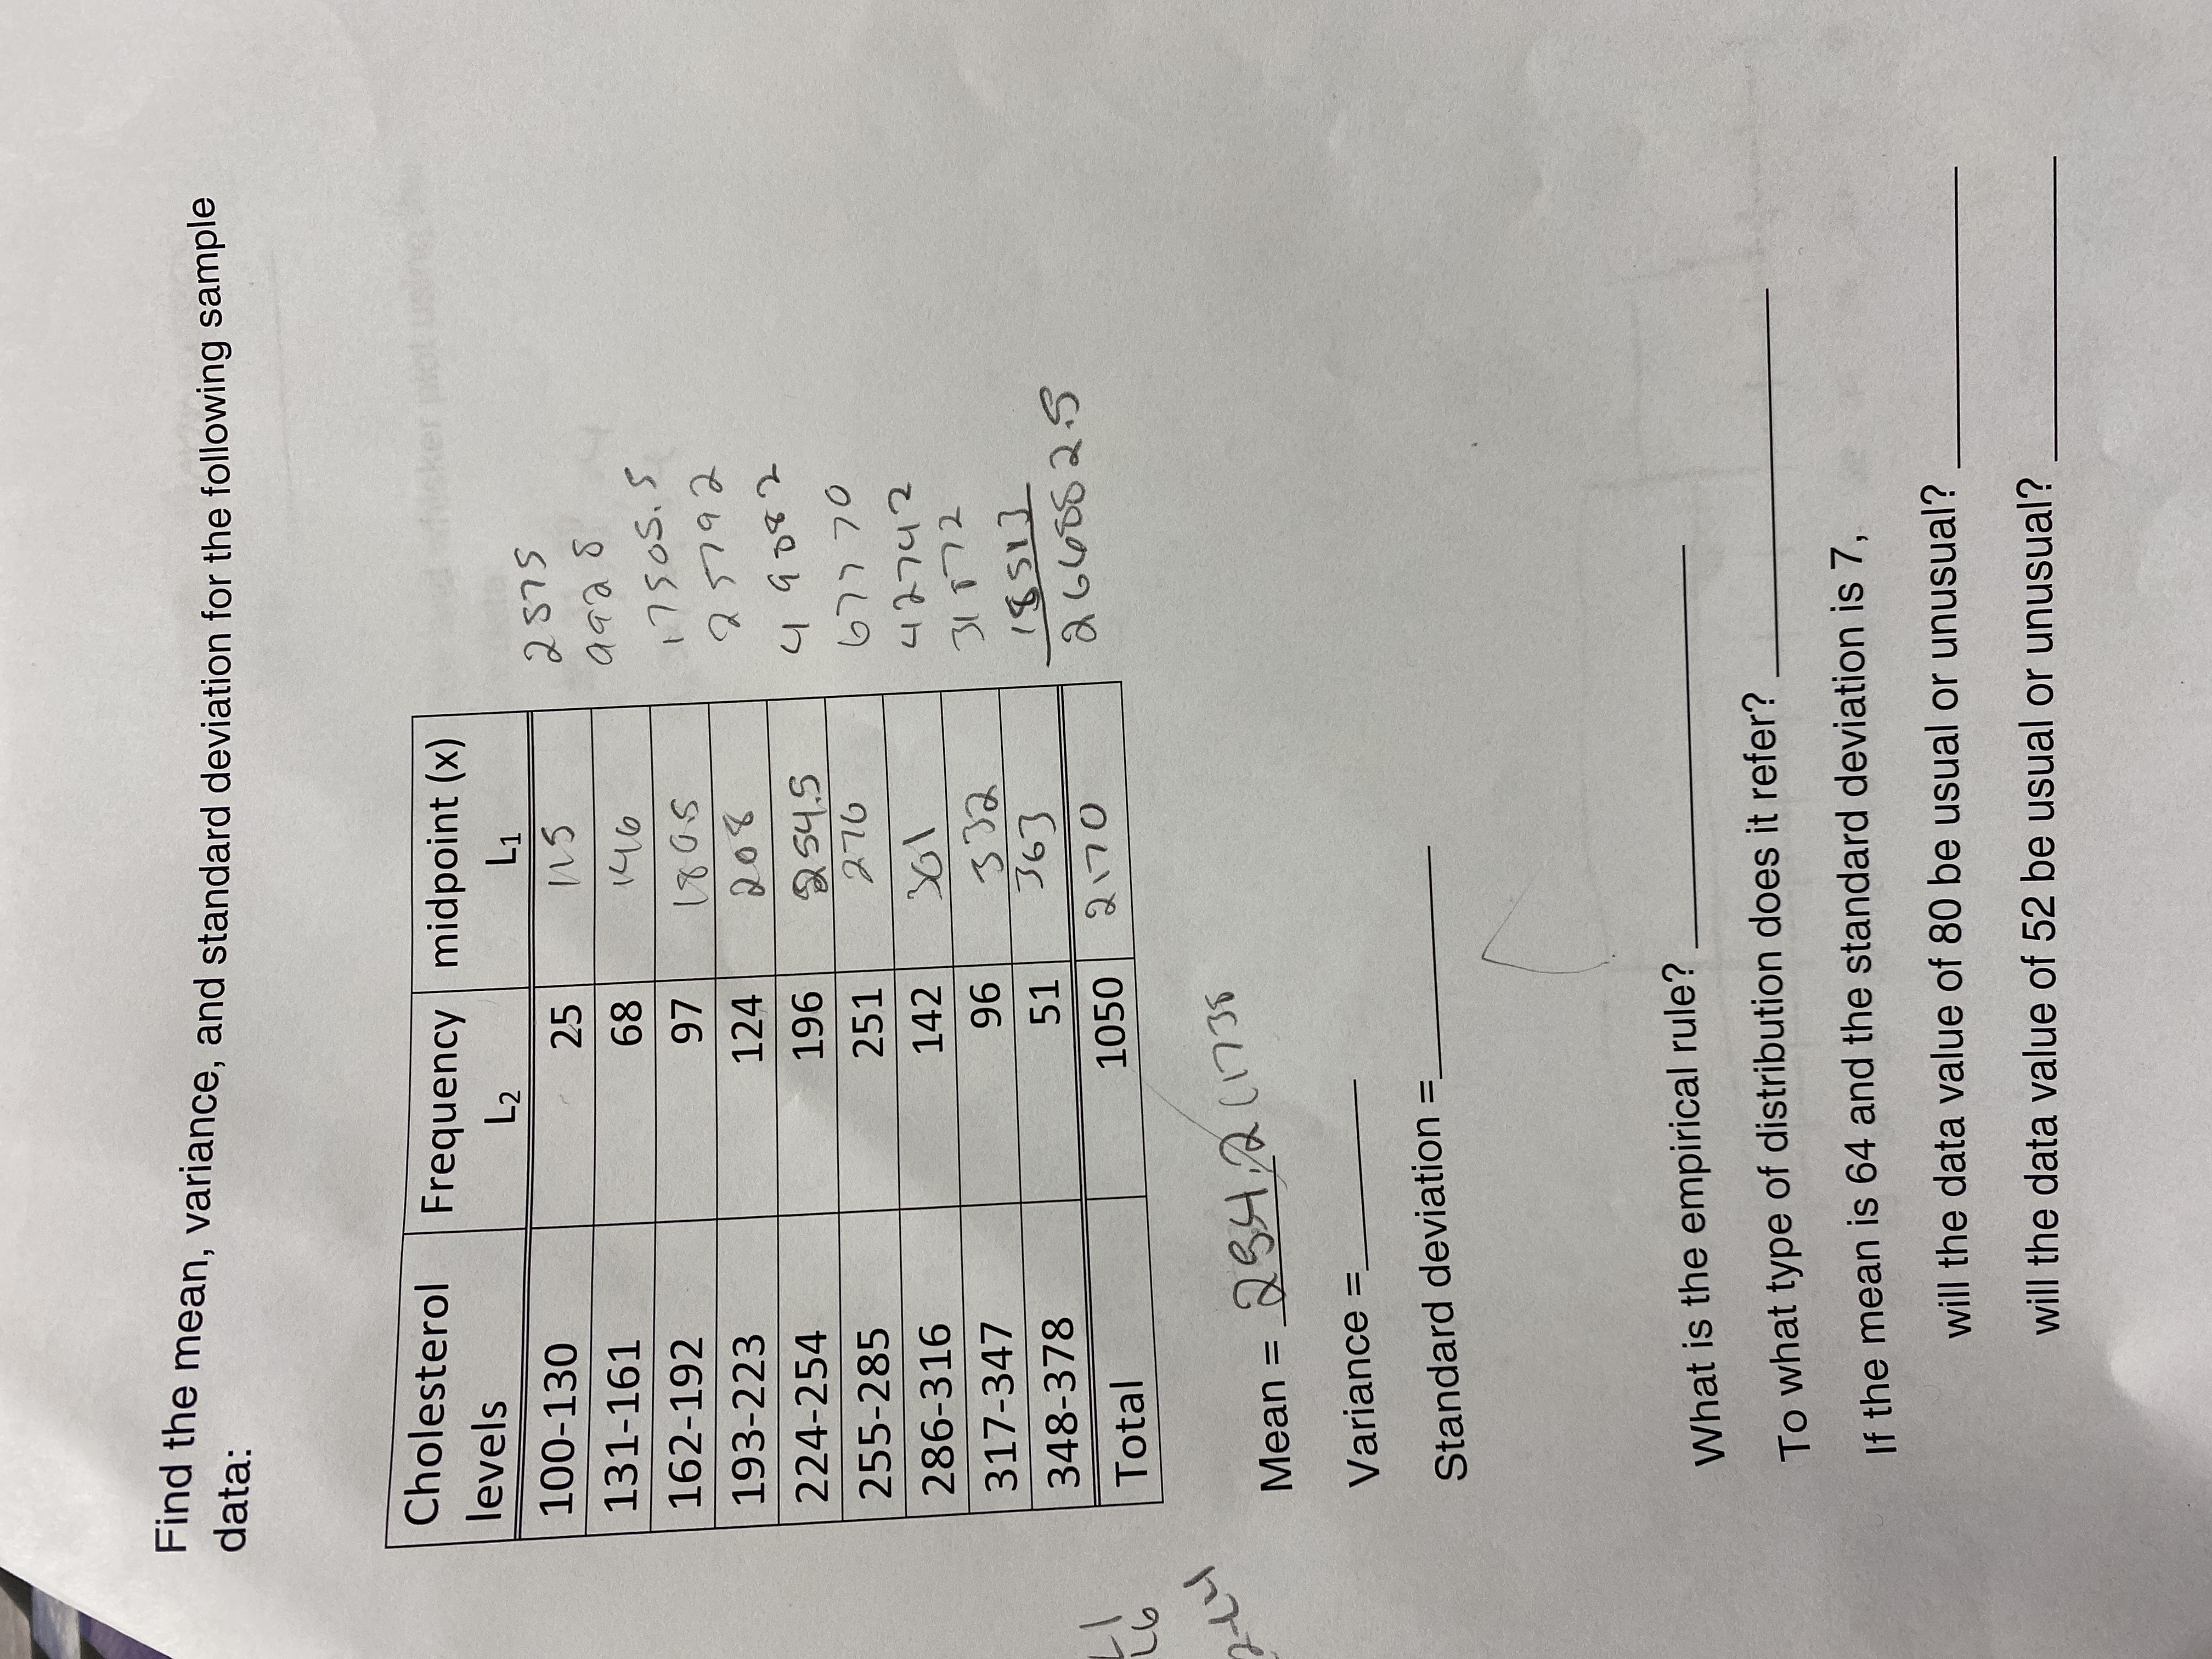
data: Find the mean, variance, and standard deviation for the following sample Cholesterol levels Frequency| midpoint (x) L2 L1 100-130 25 2575 131-161 68 146 162-192 97 175 05. 5 193-223 124 208 2 5792 224-254 196 254.5 4 9 082 255-285 251 276 67 7 70 286-316 142 301 42742 317-347 96 3 32 3 1 $72 348-378 51 363 1851] L6 Total 1050 2170 26408 25 Mean = 2841,2 (1738 Variance = Standard deviation = What is the empirical rule? To what type of distribution does it refer? If the mean is 64 and the standard deviation is 7, will the data value of 80 be usual or unusual? will the data value of 52 be usual or unusual
Step by Step Solution
There are 3 Steps involved in it
1 Expert Approved Answer
Step: 1 Unlock

Question Has Been Solved by an Expert!
Get step-by-step solutions from verified subject matter experts
Step: 2 Unlock
Step: 3 Unlock