Question: Data for #5 provided PLEASE ANSWER QUESTION 6 Problem #5: Given the following five pairs of (x,y) values, x 24 8 6 10 7 13
 Data for #5 provided PLEASE ANSWER QUESTION 6
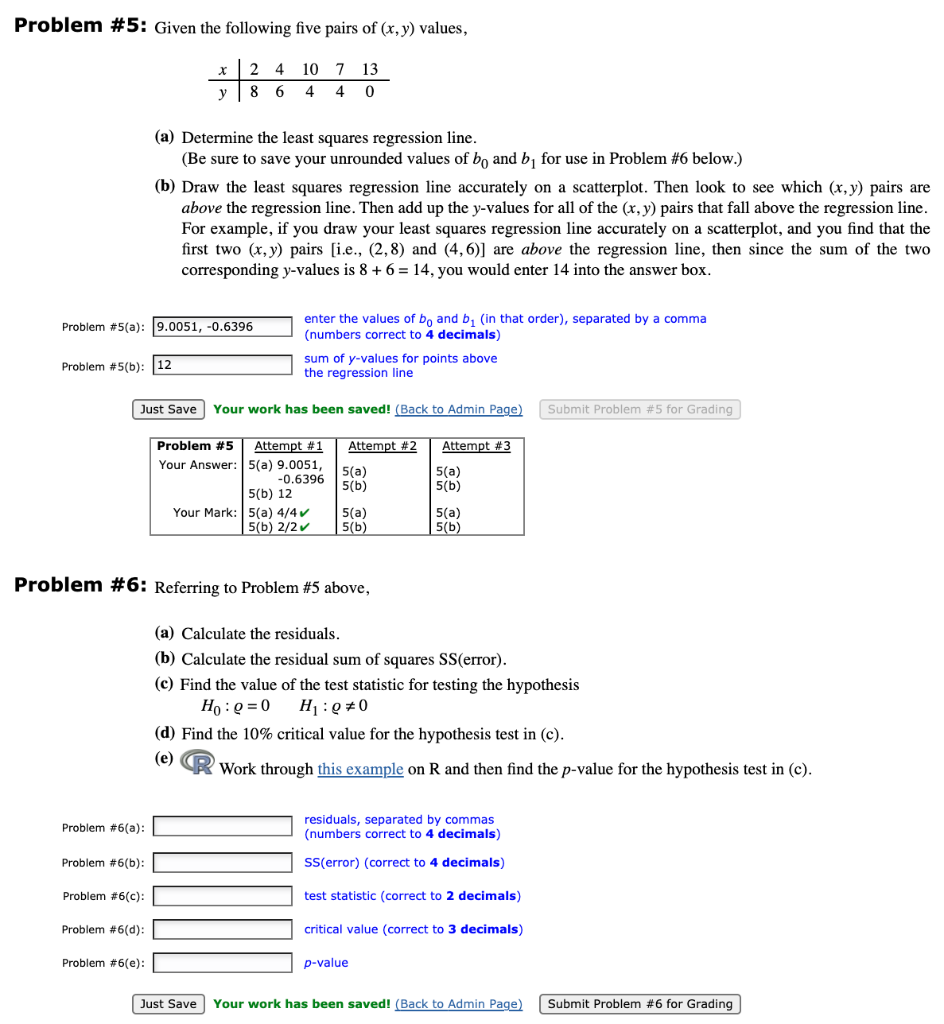
Problem #5: Given the following five pairs of (x,y) values, x 24 8 6 10 7 13 4 4 0 (a) Determine the least squares regression line. (Be sure to save your unrounded values of bo and by for use in Problem #6 below.) (b) Draw the least squares regression line accurately on a scatterplot. Then look to see which (x,y) pairs are above the regression line. Then add up the y-values for all of the (x,y) pairs that fall above the regression line. For example, if you draw your least squares regression line accurately on a scatterplot, and you find that the first two (x,y) pairs [i.e., (2,8) and (4,6)] are above the regression line, then since the sum of the two corresponding y-values is 8+6 = 14, you would enter 14 into the answer box. Problem #5(a): 9.0051, -0.6396 enter the values of bo and b (in that order), separated by a comma (numbers correct to 4 decimals) sum of y-values for points above the regression line Problem #5(b): 12 Just Save Your work has been saved! (Back to Admin Page) Submit Problem #5 for Grading Attempt #2 Attempt #3 Problem #5 Attempt #1 Your Answer: 5(a) 9.0051, -0.6396 5(b) 12 Your Mark: 5(a) 4/4 5(b) 2/2 5(a) 5(b) 5(a) 5(b) 5(a) 5(b) 5(a) 5(b) Problem #6: Referring to Problem #5 above, (a) Calculate the residuals. (b) Calculate the residual sum of squares SS(error). (c) Find the value of the test statistic for testing the hypothesis H = 0 H00 (d) Find the 10% critical value for the hypothesis test in (c). (e) Work through this example on R and then find the p-value for the hypothesis test in (c). Problem #6(a): residuals, separated by commas (numbers correct to 4 decimals) Problem #6(b): SS(error) (correct to 4 decimals) Problem #6(c): test statistic (correct to 2 decimals) Problem #6(d): critical value (correct to 3 decimals) Problem #6(e): p-value Just Save Your work has been saved! (Back to Admin Page) Submit Problem #6 for Grading Problem #5: Given the following five pairs of (x,y) values, x 24 8 6 10 7 13 4 4 0 (a) Determine the least squares regression line. (Be sure to save your unrounded values of bo and by for use in Problem #6 below.) (b) Draw the least squares regression line accurately on a scatterplot. Then look to see which (x,y) pairs are above the regression line. Then add up the y-values for all of the (x,y) pairs that fall above the regression line. For example, if you draw your least squares regression line accurately on a scatterplot, and you find that the first two (x,y) pairs [i.e., (2,8) and (4,6)] are above the regression line, then since the sum of the two corresponding y-values is 8+6 = 14, you would enter 14 into the answer box. Problem #5(a): 9.0051, -0.6396 enter the values of bo and b (in that order), separated by a comma (numbers correct to 4 decimals) sum of y-values for points above the regression line Problem #5(b): 12 Just Save Your work has been saved! (Back to Admin Page) Submit Problem #5 for Grading Attempt #2 Attempt #3 Problem #5 Attempt #1 Your Answer: 5(a) 9.0051, -0.6396 5(b) 12 Your Mark: 5(a) 4/4 5(b) 2/2 5(a) 5(b) 5(a) 5(b) 5(a) 5(b) 5(a) 5(b) Problem #6: Referring to Problem #5 above, (a) Calculate the residuals. (b) Calculate the residual sum of squares SS(error). (c) Find the value of the test statistic for testing the hypothesis H = 0 H00 (d) Find the 10% critical value for the hypothesis test in (c). (e) Work through this example on R and then find the p-value for the hypothesis test in (c). Problem #6(a): residuals, separated by commas (numbers correct to 4 decimals) Problem #6(b): SS(error) (correct to 4 decimals) Problem #6(c): test statistic (correct to 2 decimals) Problem #6(d): critical value (correct to 3 decimals) Problem #6(e): p-value Just Save Your work has been saved! (Back to Admin Page) Submit Problem #6 for Grading


