

Question: Data for Cannot be Reach Trading Company are given below: Revenue Cost of Goods Sold Gross Profit Selling and General Expenses Other Expenses Net
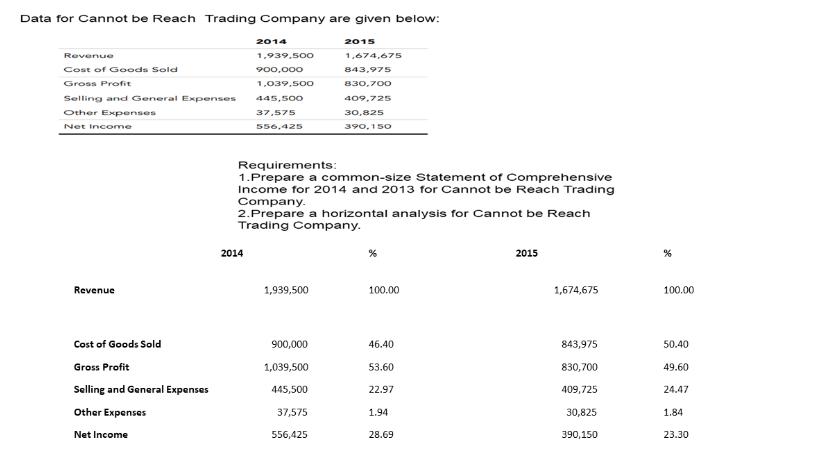
Data for Cannot be Reach Trading Company are given below: Revenue Cost of Goods Sold Gross Profit Selling and General Expenses Other Expenses Net Income Revenue Cost of Goods Sold Gross Profit Selling and General Expenses Other Expenses Net Income 2014 2014 1,939,500 900,000 1,039,500 445,500 37,575 556,425 1,939,500 2015 Requirements: 1.Prepare a common-size Statement of Comprehensive Income for 2014 and 2013 for Cannot be Reach Trading Company. 2. Prepare a horizontal analysis for Cannot be Reach Trading Company. 900,000 1,039,500 445,500 37,575 556,425 1,674,675 843,975 830,700 409,725 30,825 390,150 100.00 46.40 53.60 22.97 1.94 28.69 2015 1,674,675 843,975 830,700 409,725 30,825 390,150 % 100.00 50.40 49.60 24.47 1.84 23.30
Step by Step Solution
3.45 Rating (148 Votes )
There are 3 Steps involved in it
1To calculate the percentage of each item relative to total revenue EQ itemtota... View full answer

Get step-by-step solutions from verified subject matter experts