

Question: Data for exercise: 2012 states data.sav Variables for exercise: PercentRural: percentage of the residents who are living in the rural area. BurglaryRt: Burglary Rate per
Data for exercise: 2012 states data.sav
Variables for exercise:
PercentRural: percentage of the residents who are living in the rural area.
BurglaryRt: Burglary Rate per 100k.
MVTheftRT: motor vehicle rate per 100k.
Estimate Pearson's Correlation Coefficient for PercentRural and BurglaryRT. Interpret the results.
Estimate Pearson's Correlation Coefficient for PercentRural and MVTheftRT. Interpret the results.
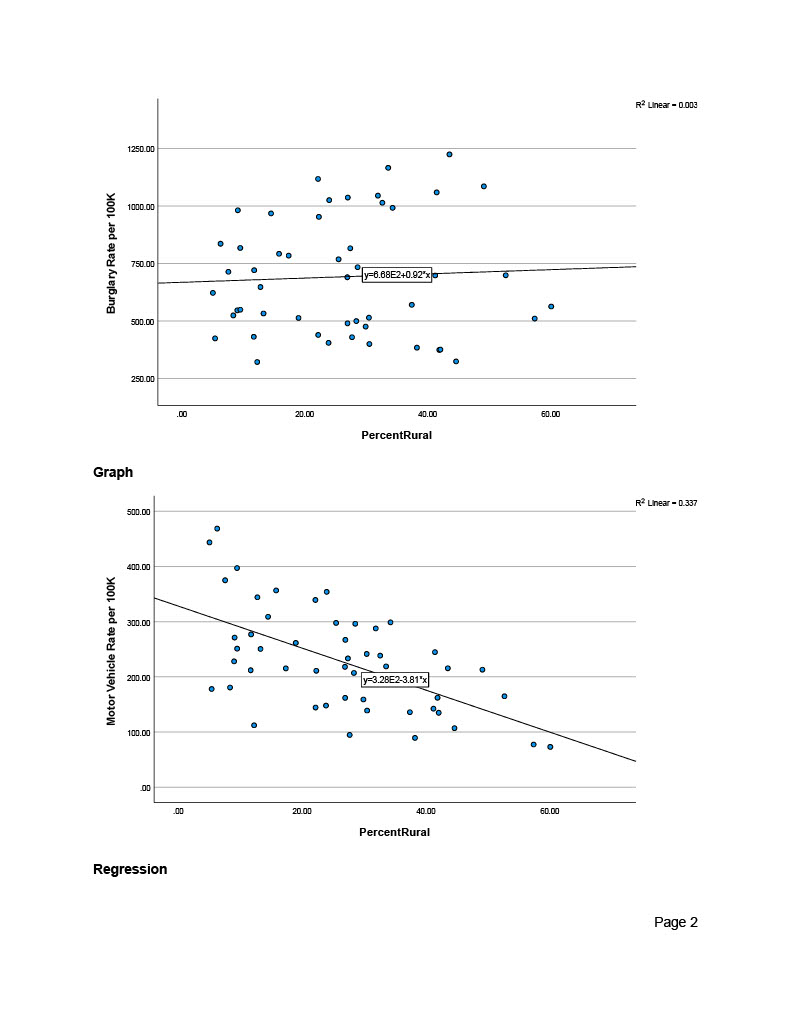
Construct a Scatter Plot for PercentRural and BurglaryRT.
Construct a Scatter Plot for PercentRural and MVTheftRT.
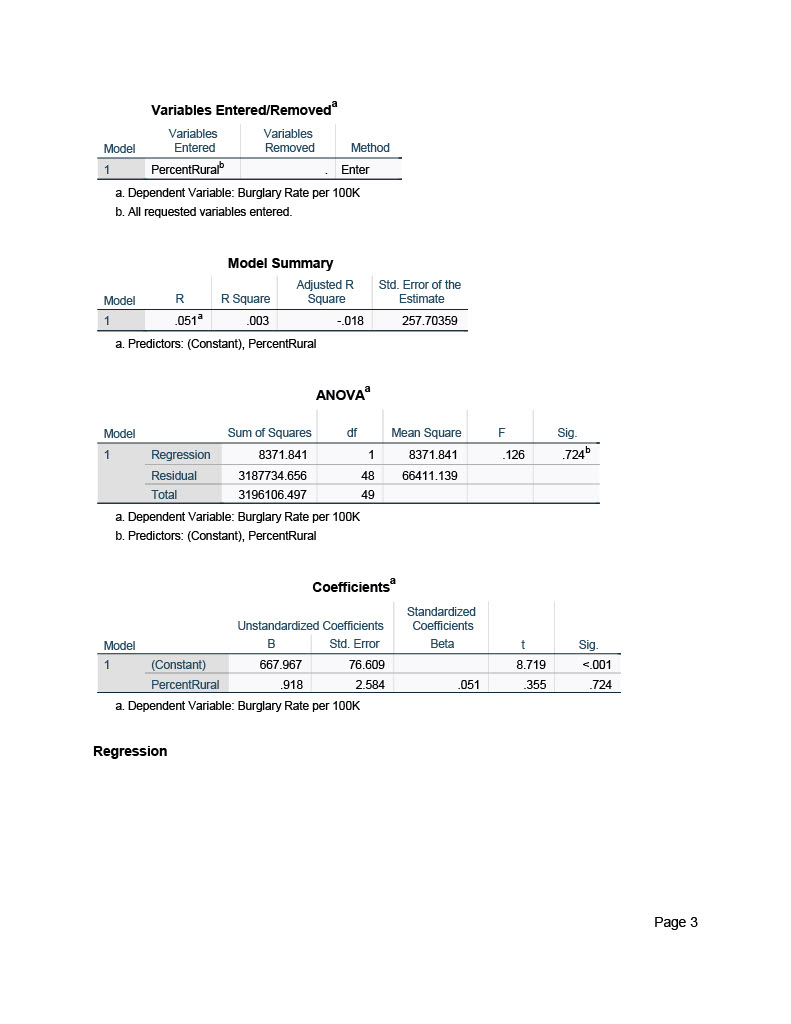
Estimate a linear regression model on BurglaryRT using PercentRural as the independent variable.
Put together a few sentences to summarize your regression results (hint: interpret your intercept, regression coefficient, R-squared, and hypothesis testing results).
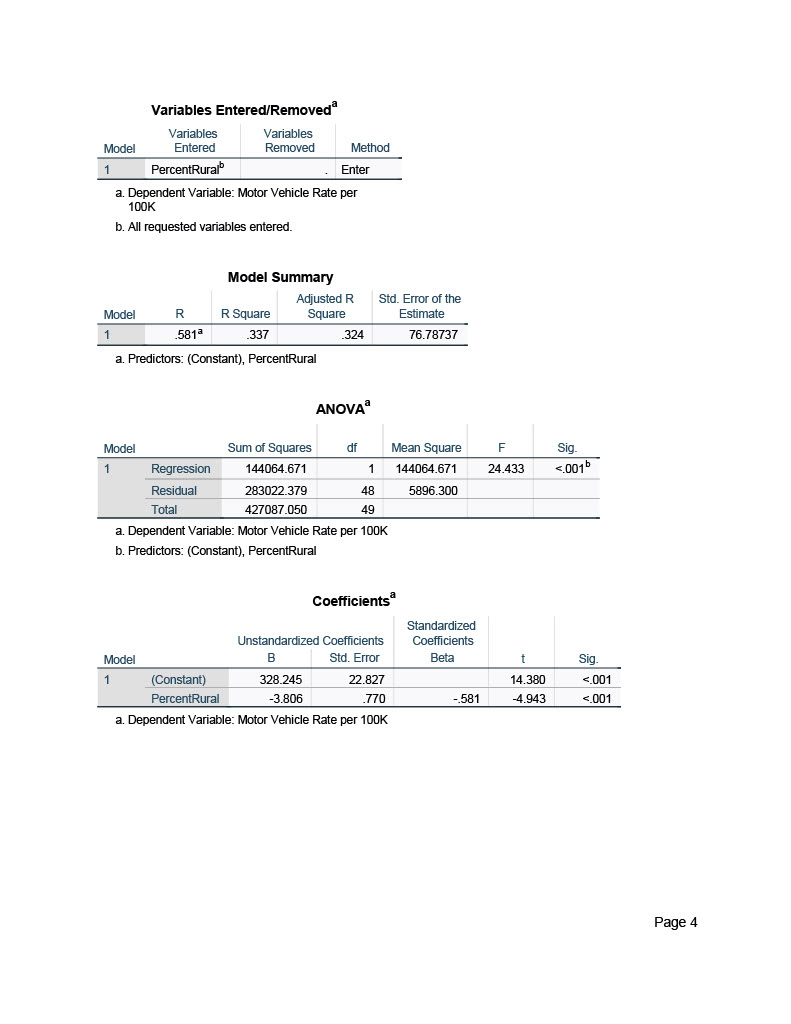
Estimate a linear regression model on MVTheftRT using PercentRural as the independent variable.
Put together a few sentences to summarize your regression results (hint: interpret your intercept, regression coefficient, R-squared, and hypothesis testing results).
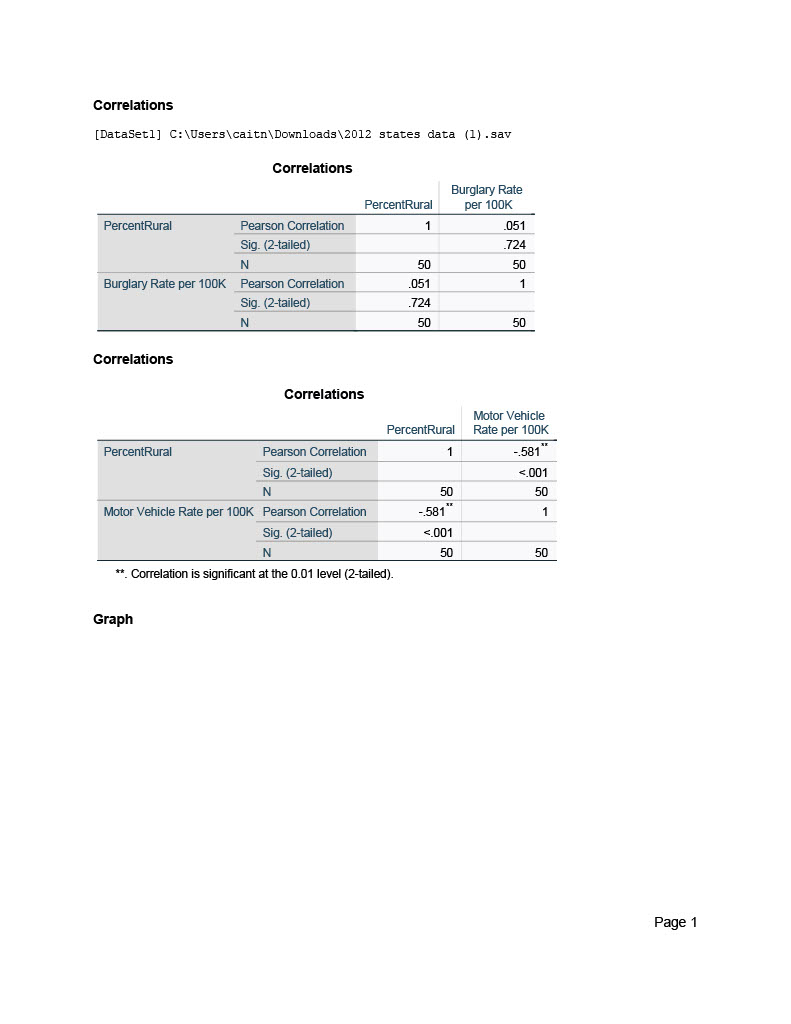
Correlations [DataSet]] C:\\Users\\caitn\\Downloads\\2012 states data (1) . sav Correlations Burglary Rate PercentRural per 100K PercentRural Pearson Correlation 051 Sig. (2-tailed) 724 N 50 50 Burglary Rate per 100K Pearson Correlation 051 Sig. (2-tailed) 724 N 50 50 Correlations Correlations Motor Vehicle PercentRural Rate per 100K PercentRural Pearson Correlation .581 Sig. (2-tailed) <.001 n motor vehicle rate per pearson correlation .581 sig. is significant at the level graph page linear burglary y='6.6862+0.92"x' percentrural r regression entered variables mode removed method enter a. dependent variable: b. all requested entered. model summary adjusted std. error of square estimate .018 predictors: anova sum squares df mean f .126 residual total coefficients standardized unstandardized b beta sig :001>
Step by Step Solution
There are 3 Steps involved in it

Get step-by-step solutions from verified subject matter experts