

Question: Data for Graph # 2 This data represents the ages of 40 patients seen in the emergency room of a hospital on a Saturday night.
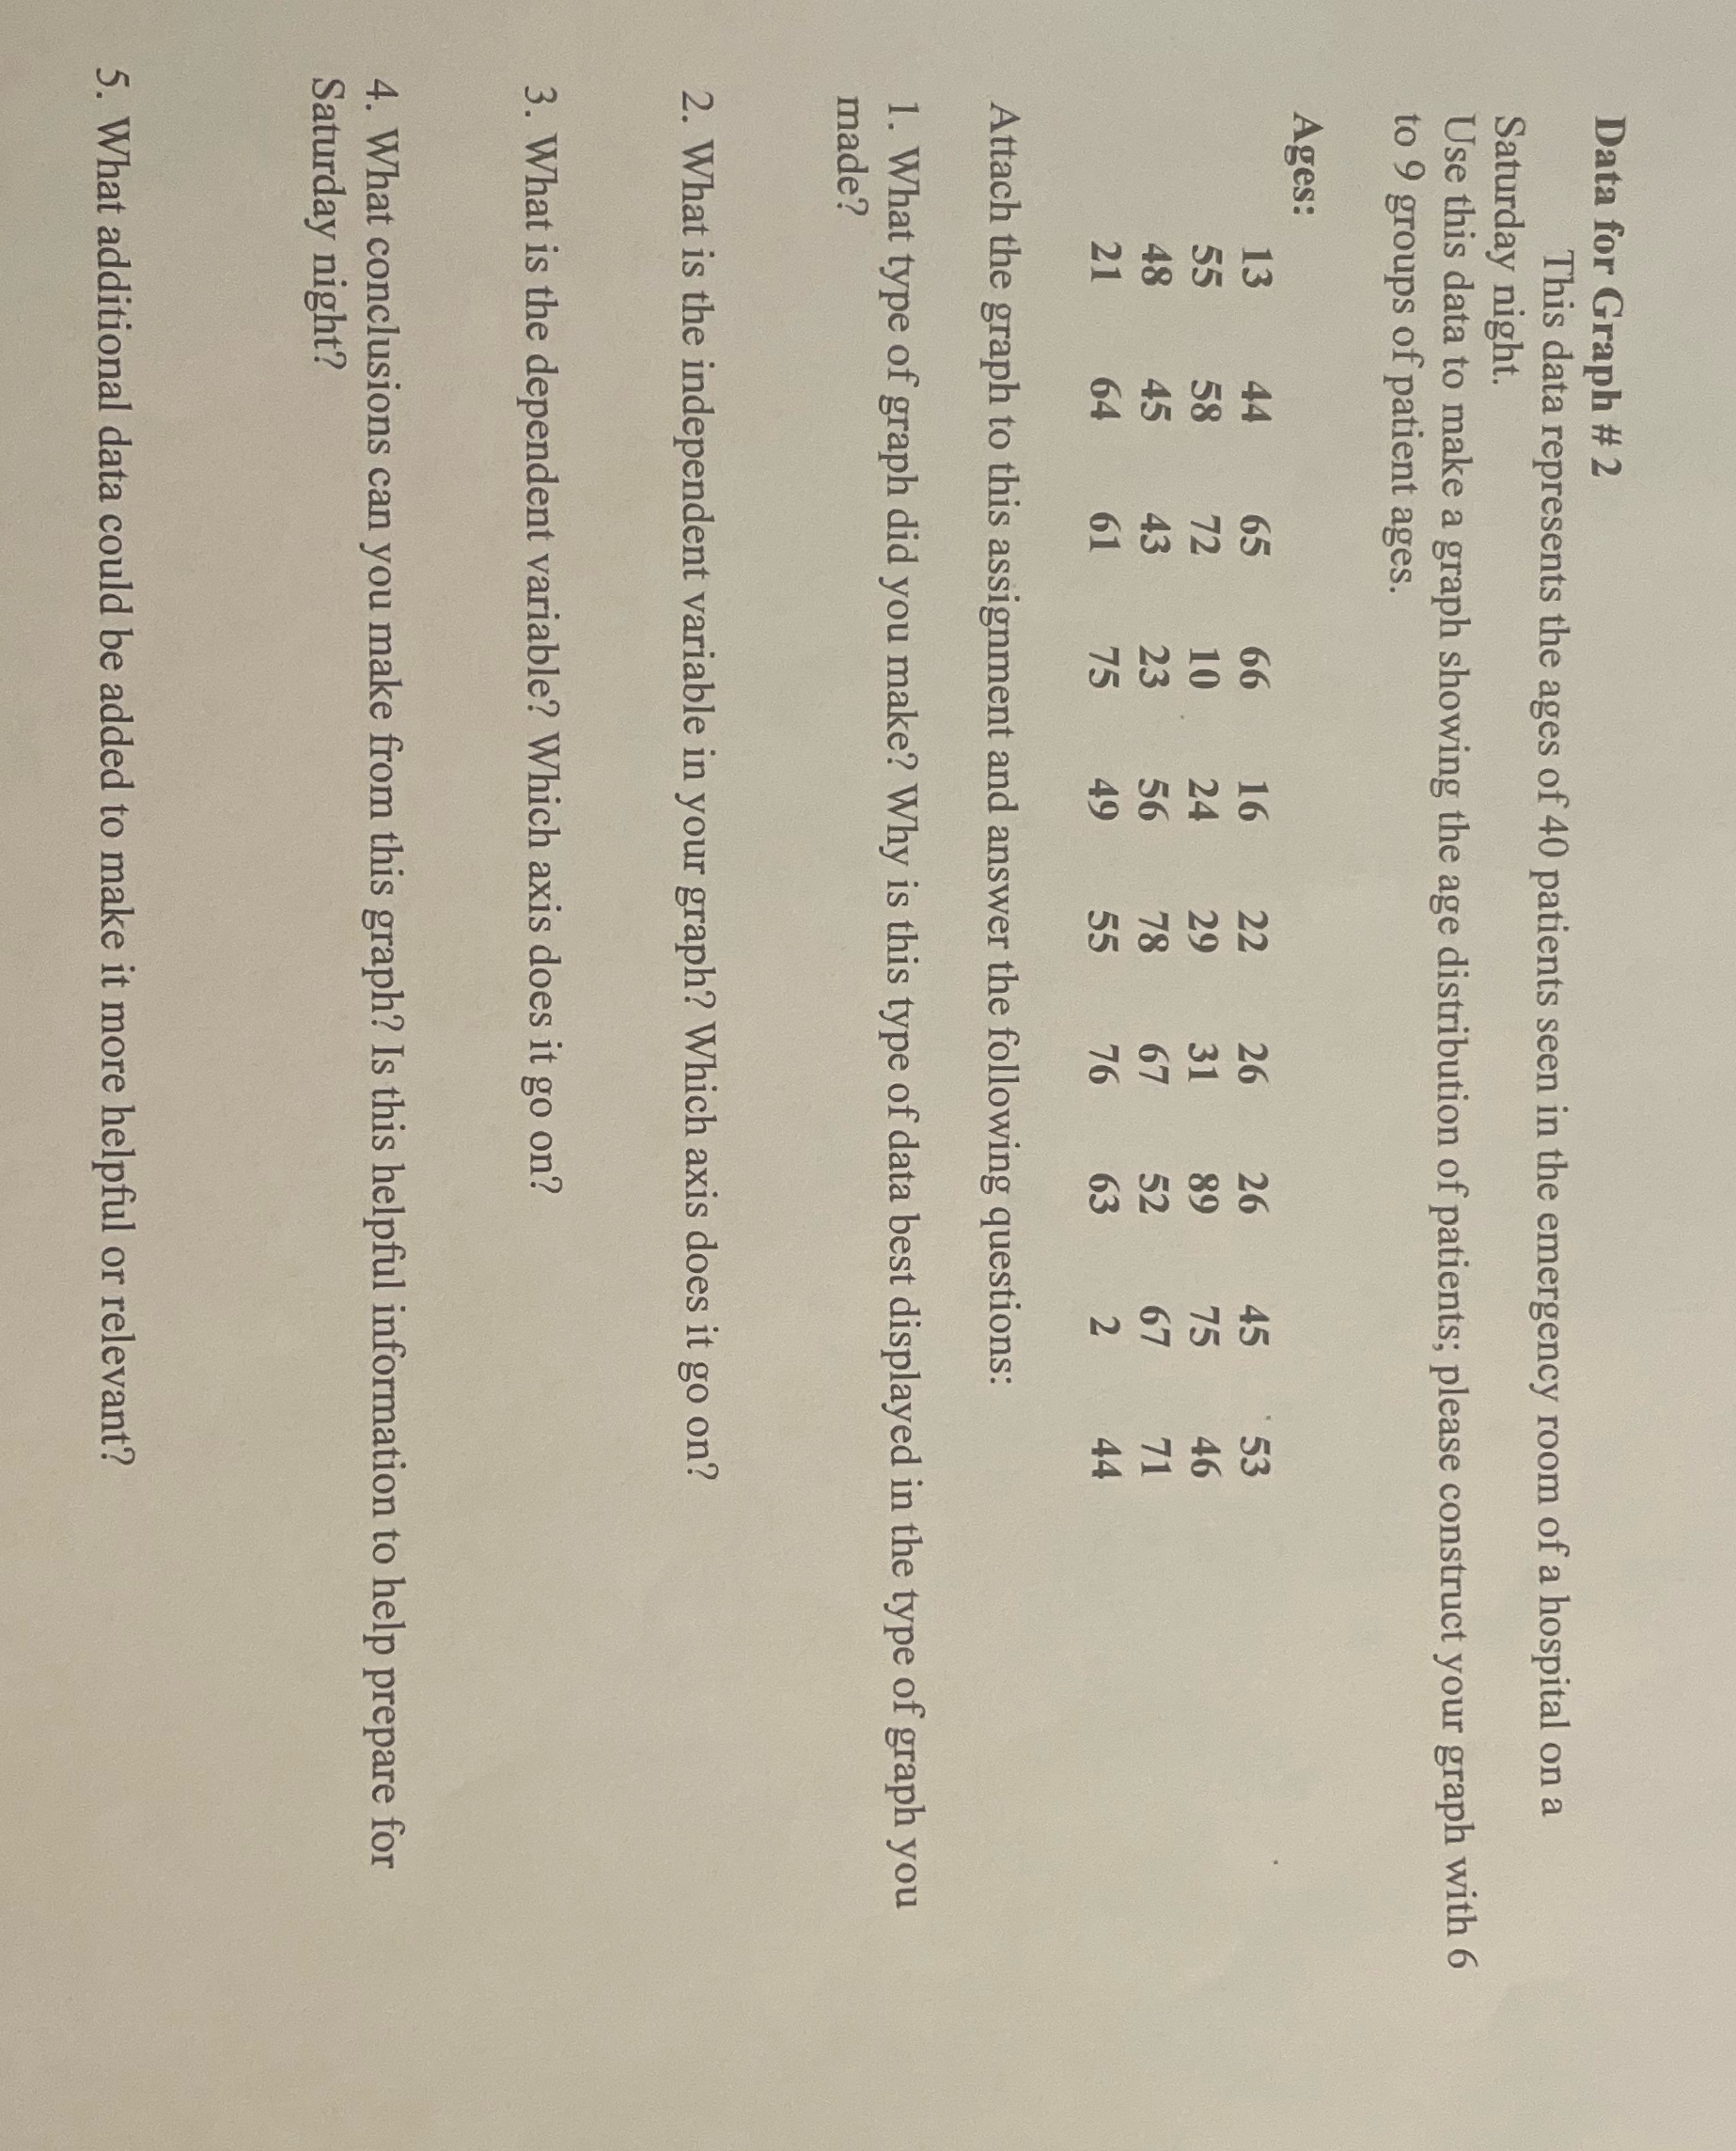
Data for Graph # 2 This data represents the ages of 40 patients seen in the emergency room of a hospital on a Saturday night. Use this data to make a graph showing the age distribution of patients; please construct your graph with 6 to 9 groups of patient ages. Ages: 58 15 N Attach the graph to this assignment and answer the following questions: 1. What type of graph did you make? Why is this type of data best displayed in the type of graph you made? 2. What is the independent variable in your graph? Which axis does it go on? 3. What is the dependent variable? Which axis does it go on? 4. What conclusions can you make from this graph? Is this helpful information to help prepare for Saturday night? 5. What additional data could be added to make it more helpful or relevant
Step by Step Solution
There are 3 Steps involved in it

Get step-by-step solutions from verified subject matter experts