

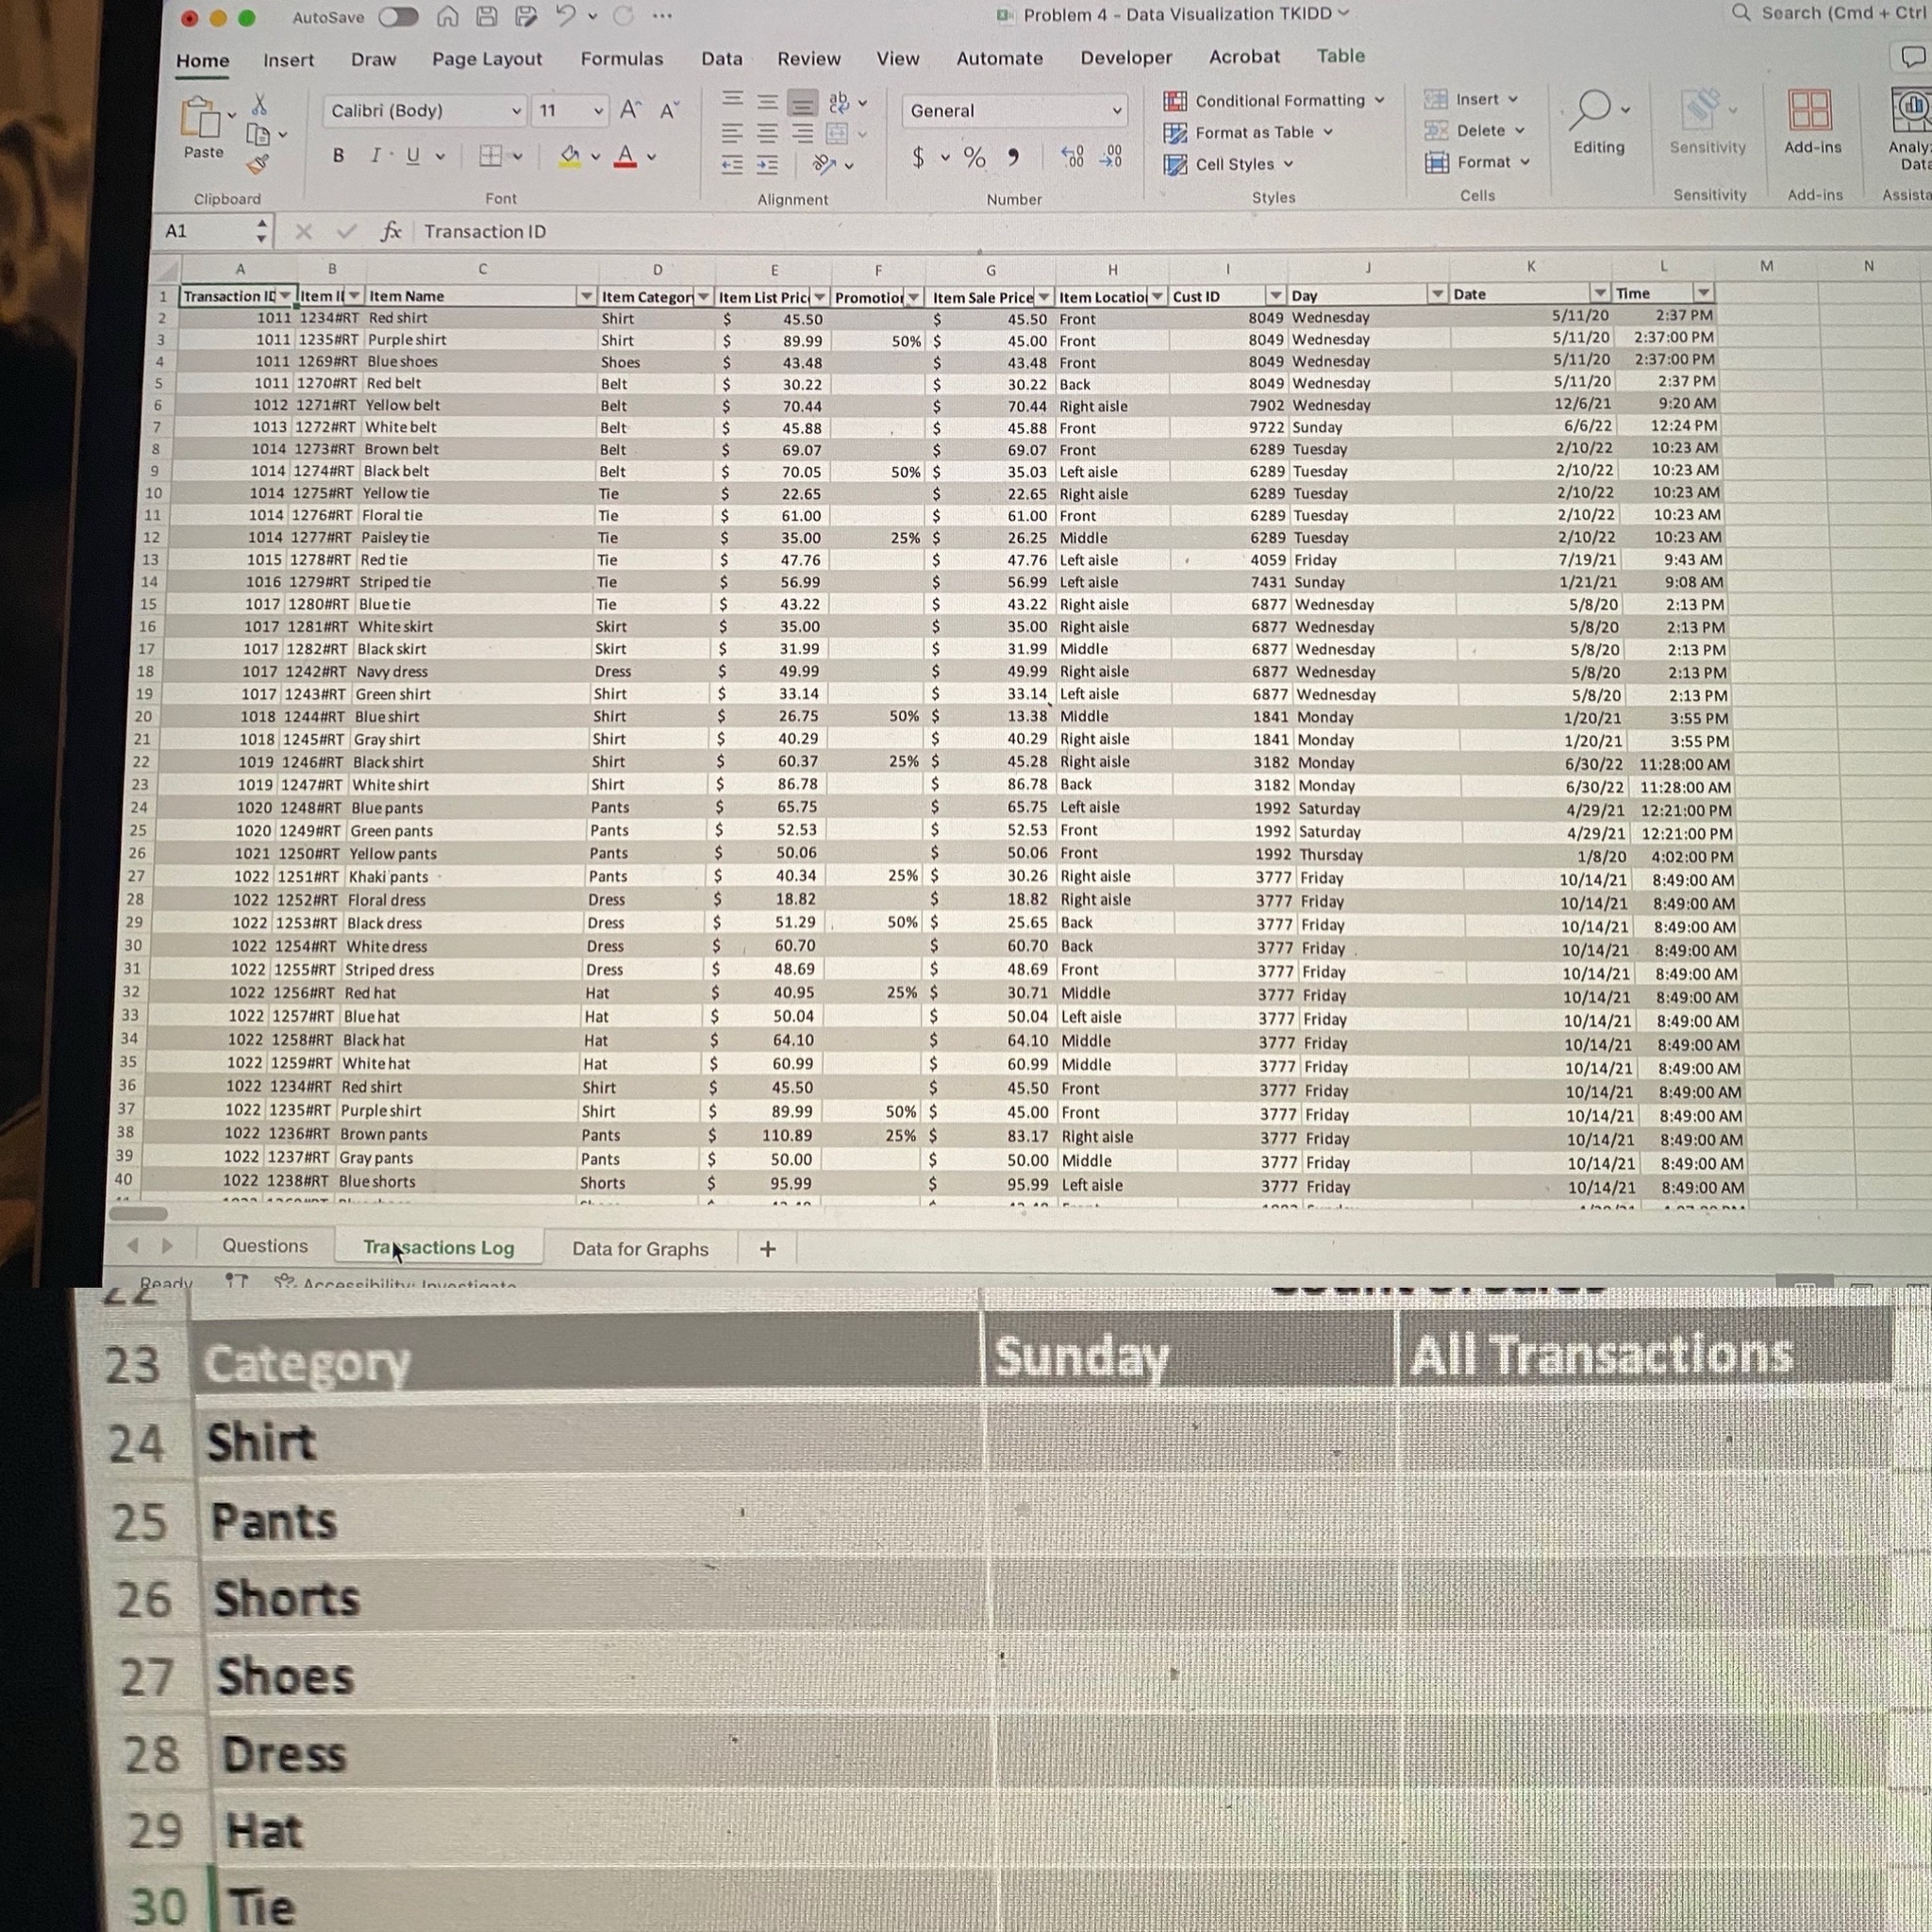
Question: Data for Graphs worksheet, Category Transactions by Day Analysis table 9 ) Fill in the Sunday column with the count of transactions within each listed
Data for Graphs worksheet, Category Transactions by Day Analysis table Fill in the "Sunday" column with the count of transactions within each listed category on that occured on a Sunday based on the data in the Transactions Log worksheet. Fill in the "All Transactions" column with the count of transactions within each listed category based on the data in the Transactions Log worksheet. Create a pie chart with the count of transactions by category for Sunday. Name the chart "TransactionsByCategorySunday" using the Name Box. Add a Chart Element for Data Labels as "Outside End". Change the Chart title to "Transactions by Category on Sunday" and position the upper left corner to be in cell G Create a pie chart with the count of transactions by category for all transations. Name the chart "TransactionsByCategory" using the Name Box. Add a Chart Element for Data Labels as Data Callout and remove the legend. Change the Chart title to "Transactions by Category" and position the upper left corner to be in cell M
Step by Step Solution
There are 3 Steps involved in it
1 Expert Approved Answer
Step: 1 Unlock

Question Has Been Solved by an Expert!
Get step-by-step solutions from verified subject matter experts
Step: 2 Unlock
Step: 3 Unlock