

Question: Data for Problems 5 . 1 2 - 5 . 1 5 You have collected soil samples as part of the investigation for a dam
Data for Problems
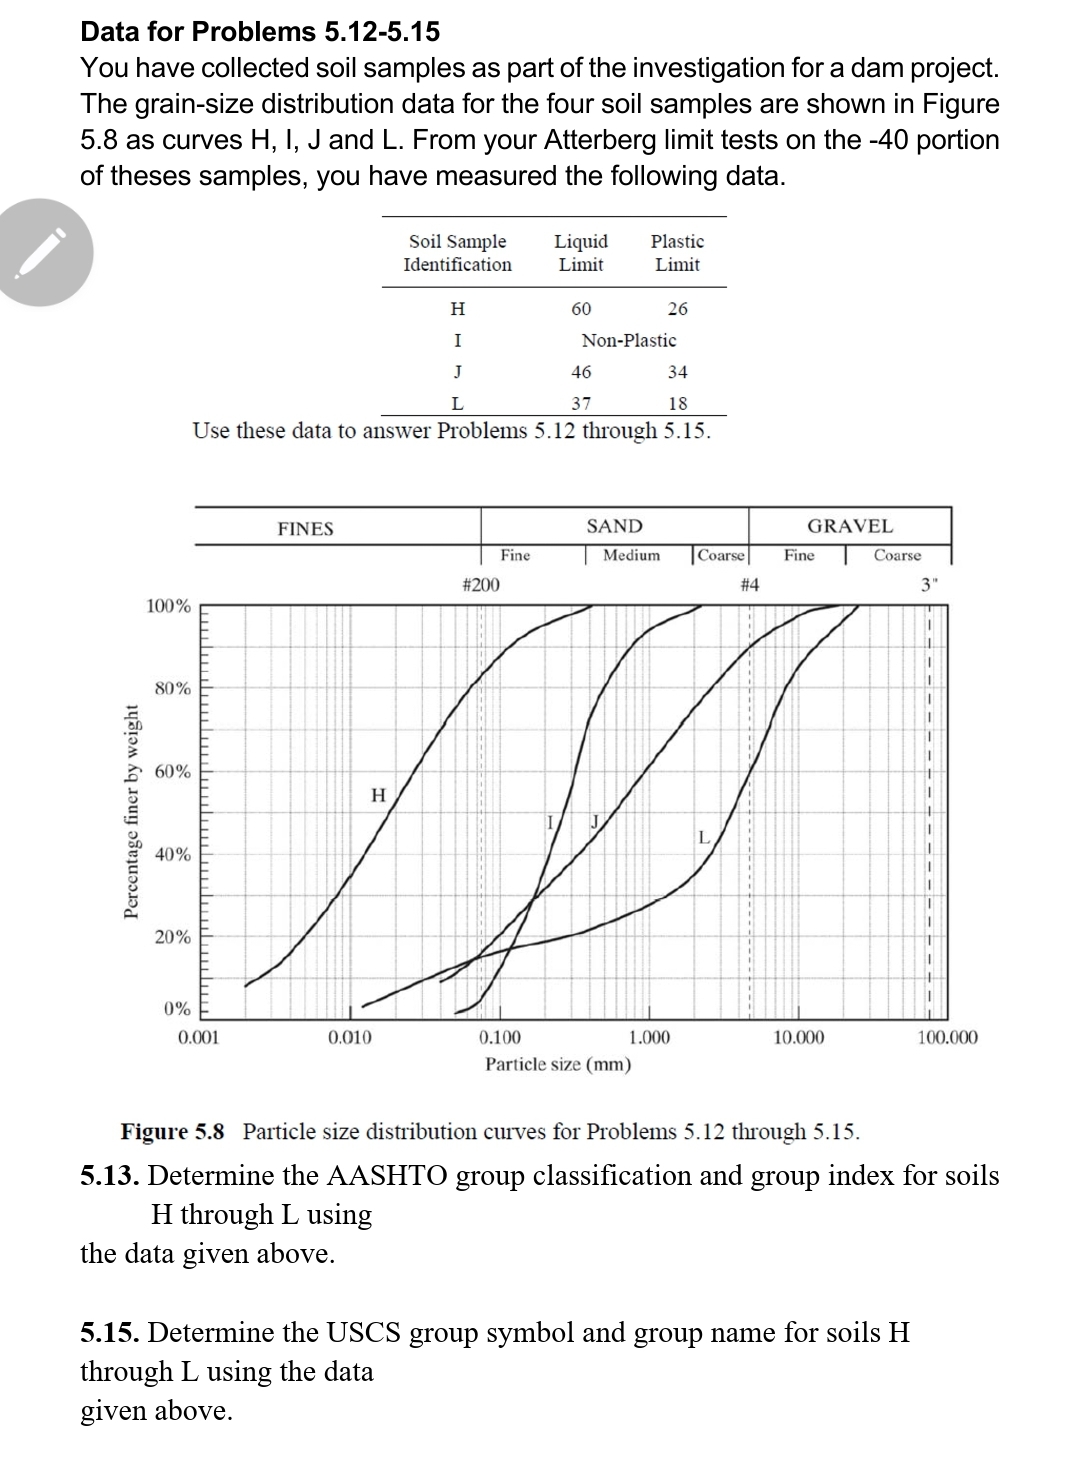
You have collected soil samples as part of the investigation for a dam project. The grainsize distribution data for the four soil samples are shown in Figure as curves I, and L From your Atterberg limit tests on the portion of theses samples, you have measured the following data.
tabletableSoil SampleIdentificationtableLiquidLimittablePlasticLimitHINonPlasticJL
Figure Particle size distribution curves for Problems through
Determine the AASHTO group classification and group index for soils through using
the data given above.
Determine the USCS group symbol and group name for soils through using the data given above Determine and for each of the three soils in Proble
of these soils is
most wellgraded? Why?
Step by Step Solution
There are 3 Steps involved in it
1 Expert Approved Answer
Step: 1 Unlock

Question Has Been Solved by an Expert!
Get step-by-step solutions from verified subject matter experts
Step: 2 Unlock
Step: 3 Unlock