

Question: Data for the two groups of chicks described in Problem #1 are given below. Find the five number summary of the data values (Minimum, 25%file,
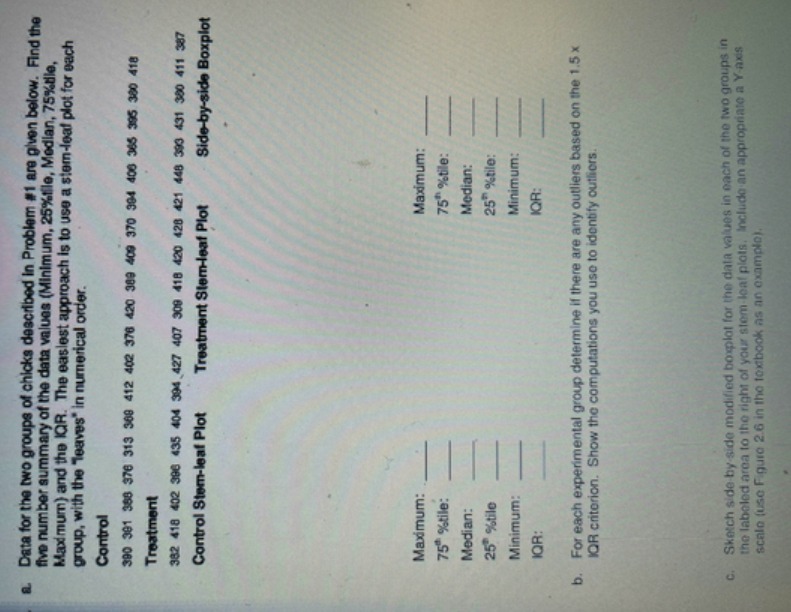
Data for the two groups of chicks described in Problem #1 are given below. Find the five number summary of the data values (Minimum, 25%file, Median, 75%tile, Mad mum) and the IQR. The easiest approach is to use a stem-leaf plot for each group, with the "leaves" in numerical order. Control 390 301 368 376 313 308 412 402 376 420 389 409 370 394 400 365 395 380 418 Treatment 382 418 402 390 435 404 394 427 407 309 418 420 428 421 468 393 431 380 411 387 Control Stem-leaf Plot Treatment Stem-leaf Plot Side-by-side Boxplot Maximum: Maximum: 75* 9%tile: 75 %tille: Median: Median: 25 96tile 25 %tile: Minimum: Minimum: IOR: IOR: b. For each experimental group determine if there are any outliers based on the 1.5 x IOR criterion. Show the computations you use to identify outliers. C. Sketch side by side modified boxplot for the data values in each of the two groups in the labeled area to the right of your stem-leaf plots, Include an appropriate a Y-axis scale (use Figure 2.6 in the foxbook as an example)
Step by Step Solution
There are 3 Steps involved in it

Get step-by-step solutions from verified subject matter experts