

Question: Data for winson group & it's industry's average are as follows: assume tax rate of 30%. a. calculate the indicated ratios for winson group b.
Data for winson group & it's industry's average are as follows: assume tax rate of 30%.
a. calculate the indicated ratios for winson group
b. based on your finding in part(a) what are winsons group strengths and weaknesses in comparing to the industry
c. construct the du-point equation for both winsons and group and the industry. what is the major reason winson group outperforms/ or underperformed the industry average in ROE
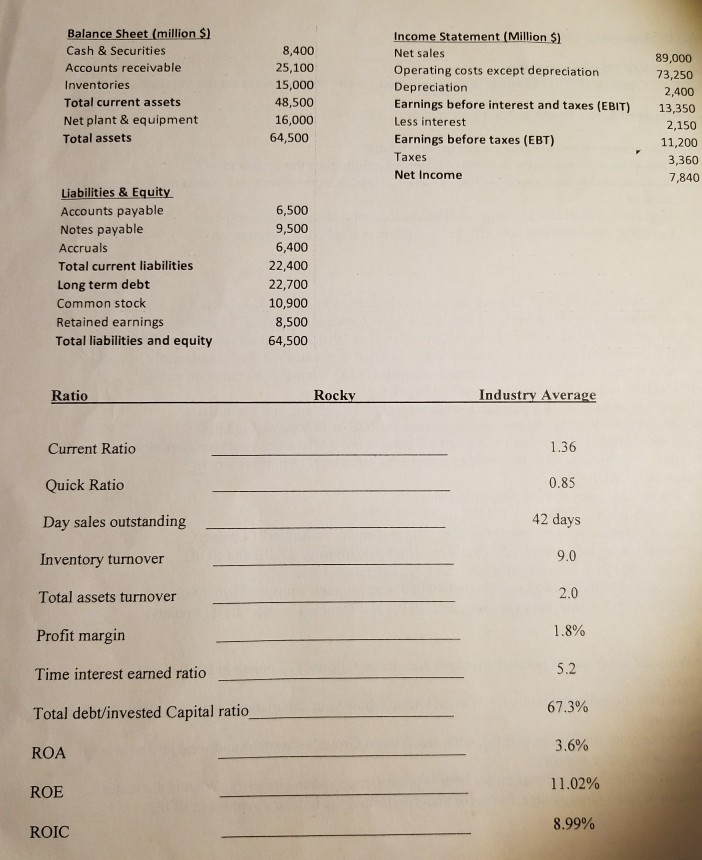
Balance Sheet (million S) Cash & Securities Accounts receivable Inventories Total current assets Net plant & equipment Total assets 8,400 25,100 15,000 48,500 16,000 64,500 Income Statement (Million $) Net sales Operating costs except depreciation Depreciation Earnings before interest and taxes (EBIT) Less interest Earnings before taxes (EBT) Taxes Net Income 89,000 73,250 2,400 13,350 2,150 11,200 3,360 7,840 Liabilities & Equity Accounts payable Notes payable Accruals Total current liabilities Long term debt Common stock Retained earnings Total liabilities and equity 6,500 9,500 6,400 22,400 22,700 10,900 8,500 64,500 Ratio Rockv 1.36 0.85 42 days 9.0 Current Ratio Quick Ratio Day sales outstanding Inventory turnover Total assets turnover Profit margin Time interest earned ratio Total debt/invested Capital ratio ROA ROE ROIC 1.8% 5.2 67.3% 3.6% 1 1 .02% 8.99%
Step by Step Solution
There are 3 Steps involved in it

Get step-by-step solutions from verified subject matter experts