

Question: data from 10-17 used to for problem 10-39 CHAPTER 10: UNCERTAINTY IN FUTURE EVENTS 360 Useful Life the next 4 years? annually and that violations
data from 10-17 used to for problem 10-39
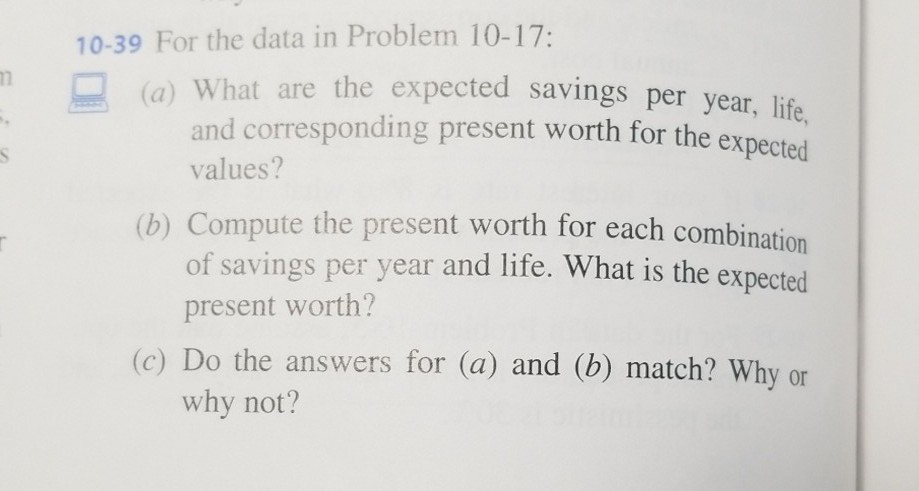
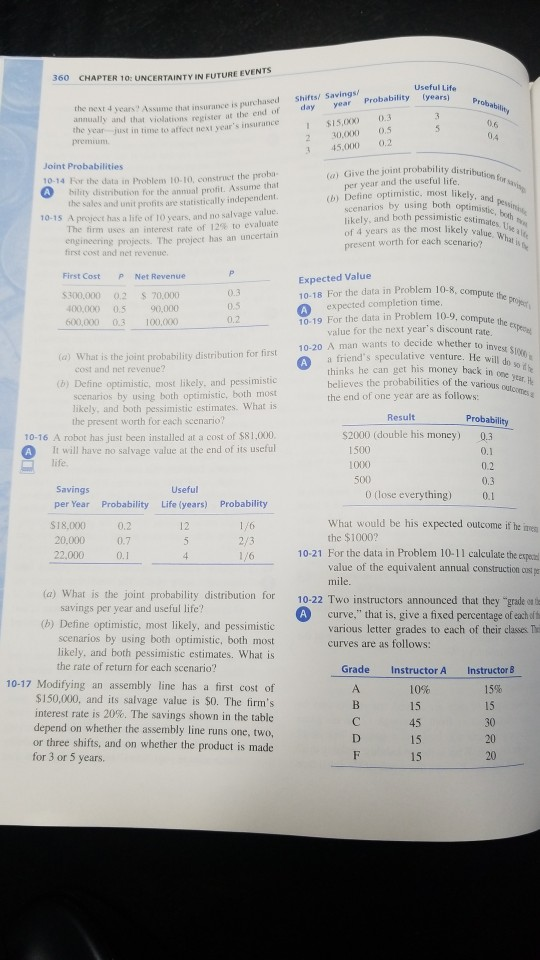
CHAPTER 10: UNCERTAINTY IN FUTURE EVENTS 360 Useful Life the next 4 years? annually and that violations register i the year just in time to affect next year's insurance Assume that insurance is purchased Shifts/ Savings t the end of day year Probability (years) $15,000 0.3 2 30,000 0.5 3 45,000 0.2 0.6 the joint probability distribution f 10-14 For the data in Problem 10.10, construct the r A bility distribution for the annual protit. Assume per year and the useful life b) Define optimistic, most likely, and scenarios by using both optt likely, and both pessimistic estimates, of 4 years as the most like a present worth for each scenario? e. W sales and unit profits are statistically independent project has a life of 10 years, and no salvage value. firm uses an interest rate of 12% to evaluate an uncertain engineering projects. The project has first cost and net revemue Expected Value 10-18 For the data in Problem 10-8, com A expected completion time First Cost PNet Revenue $300,000 0.2 S 70,000 00,0000.5 90,000 600.000 0.3 100.000 pute the 10-19 For the data in Problem 10.9, compute value for the next year's discount rate 10-20 A man wants to decide whether to a friend's speculative venture. He will do g hinks he can get his money back in believes the probabilities of the various oe the end of one year are as follows: (a) What is the joint probability distribution for first cost and net revenue? year outoomes a (b) Define optimistic, most likely, and pessimistic scenarios by using both optimistic, both most likely, and both pessimistic estimates. What is Result the present worth for each scenario S2000 (double his money) 10-16 A robot has just been installed at a cost of $81,000 It will have no salvage value at the end of its useful 0.3 A 1500 1000 life 0 (lose everything) per Year Probability Life (years) Probability $18,000 20,000 22.000 What would be his expected outcome if he inen the $1000? 0.2 10-21 For the data in Problem 10-11 calculate the expezi value of the equivalent annual construction cs mile (a) What is the joint probability distribution for 10-22 Two instructors annou nced that they "grade on ts curve," that is, give a fixed percentage of eah ofts savings per year and useful life? A (b) Define optimistic, most likely, and pessimistic scenarios by using both optimistic, both most likely, and both pessimistie estimates. What is various letter grades to each of their classes The curves are as follows: the rate of return for each scenario? Grade Instructor A Instructor B 10-17 Modifying an assembly line has a first cost of $150,000, and its salvage value is $0. The firm's interest rate is 20%The savings shown in the table depend on whether the assembly line runs one, two, or three shifts, and on whether the product is made 15% 15 15 20 20 15 15 for 3 or 5 years 10-39 For the data in Problem 10-17: a) What are the expected savings per year, life, and corresponding present worth for the expected values? (b) Compute the present worth for each combination pected of savings per year and life. What is the ex present worth? (c) Do the answers for (a) and (b) match? Why or why not
Step by Step Solution
There are 3 Steps involved in it

Get step-by-step solutions from verified subject matter experts