

Question: Data from 20 participants in a creatine supplementation study are presented below. All participants were provided with 20 grams of creatine for 4 weeks in
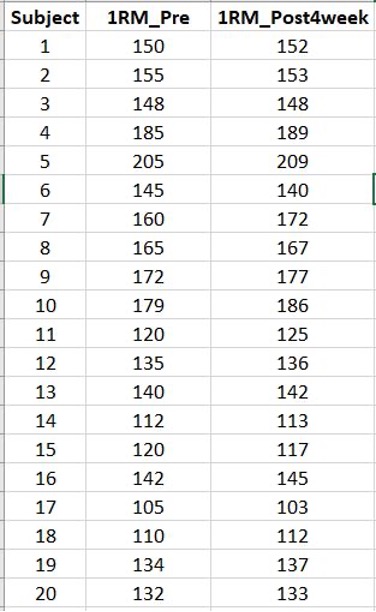
Data from 20 participants in a creatine supplementation study are presented below. All participants were provided with 20 grams of creatine for 4 weeks in combination with resistance training. Their bench press 1RM was assessed before and after the 4 weeks of supplementation/training.
a. Calculate the mean, standard deviation (SD), and standard error of the mean (SEM) for the pre and post 1RM data
b. State the correct statistical test that should be performed to determine if there was an increase in 1RM
c. Perform the appropriate statistical test (identified in part b) comparing the pre and post data
d. Clearly state the result of the above statistical procedure (i.e. p-value) along with an interpretation of the result
e. Construct a two-column bar chart illustrating the mean of the pre and post 1RM (i.e. not individual data).This chart should contain: axis titles, column titles (i.e. PRE, POST), error bars (preferably SEM), and, if a statistical difference was noted, a prudently placed asterisk over one of the bars along with a key for the meaning of the asterisk).
f. Based on the study design, can you categorically state that creatine supplementation was the cause of the increase in 1RM? If not, describe any adjustments to the study design that would permit this. How would that affect the statistical procedure that would be used?
\f
Step by Step Solution
There are 3 Steps involved in it

Get step-by-step solutions from verified subject matter experts