

Question: Data from 28 students is presented below. Each student was assessed on their crossword ability and mathematical ability. Construct a well-designed scatterplot with appropriate axis
- Data from 28 students is presented below. Each student was assessed on their crossword ability and mathematical ability.
- Construct a well-designed scatterplot with appropriate axis titles, etc. (x-axis = crossword ability, y-axis = mathematical ability)
- State the correlation (r) between crossword ability and mathematical ability, along with its direction and magnitude
- What is the regression equation to predict mathematical ability from crossword ability?
- Using the regression equation, calculate what a score of 62 on crossword ability would predict for their mathematical ability
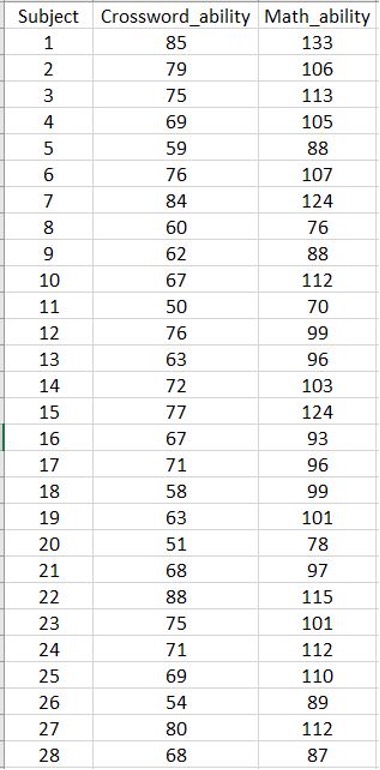
Subject Crossword_ability Math_ability 1 85 133 79 106 75 113 69 105 59 88 LD CO - O U AWN 76 107 84 124 60 76 62 88 10 67 112 11 50 70 12 76 99 13 63 96 14 72 103 15 77 124 16 67 93 17 71 96 18 58 99 19 63 101 20 51 78 21 68 97 22 88 115 23 75 101 24 71 112 25 69 110 26 54 89 27 80 112 28 68 87
Step by Step Solution
There are 3 Steps involved in it
1 Expert Approved Answer
Step: 1 Unlock

Question Has Been Solved by an Expert!
Get step-by-step solutions from verified subject matter experts
Step: 2 Unlock
Step: 3 Unlock