

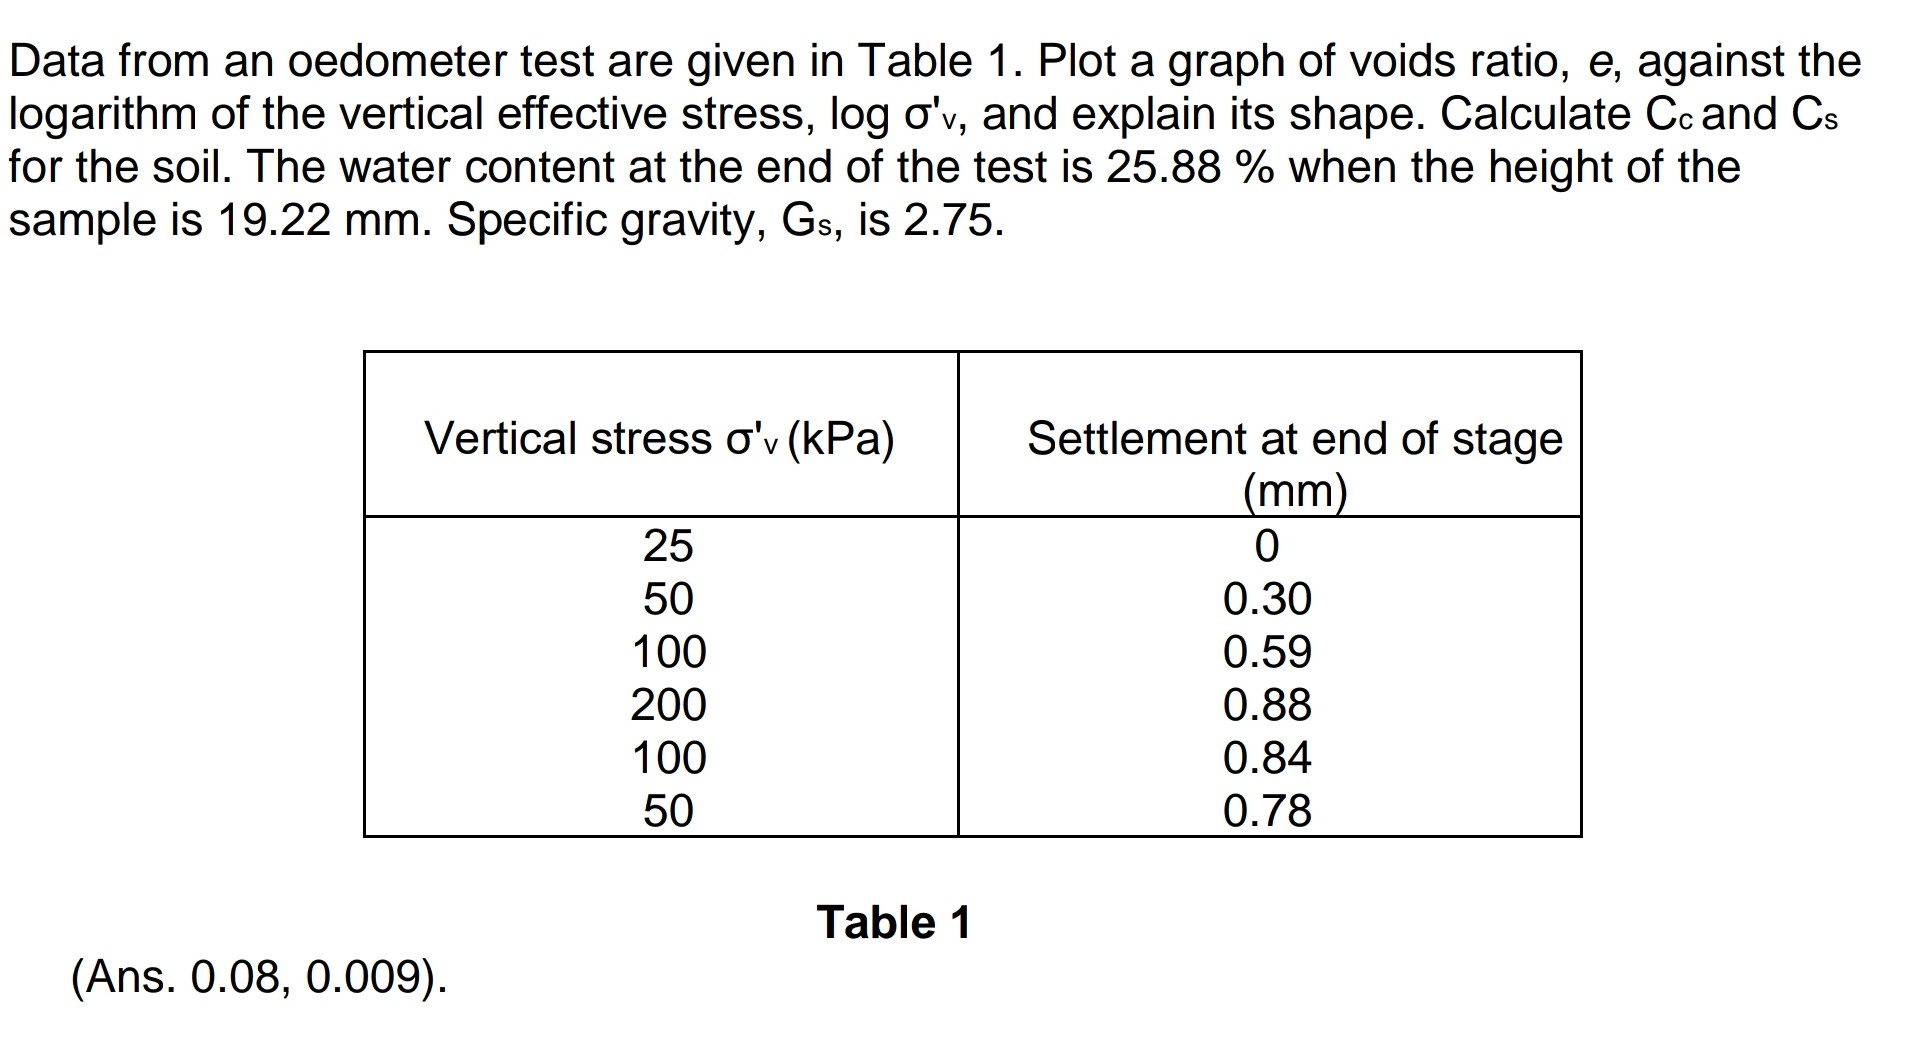
Question: Data from an oedometer test are given in Table 1 . Plot a graph of voids ratio, e , against the logarithm of the vertical
Data from an oedometer test are given in Table Plot a graph of voids ratio, against the
logarithm of the vertical effective stress, log and explain its shape. Calculate and
for the soil. The water content at the end of the test is when the height of the
sample is Specific gravity, Gs is
Table
Ans
Step by Step Solution
There are 3 Steps involved in it
1 Expert Approved Answer
Step: 1 Unlock

Question Has Been Solved by an Expert!
Get step-by-step solutions from verified subject matter experts
Step: 2 Unlock
Step: 3 Unlock