

Question: Data from problem #1 F-statistic value = 12.78402 P-value = 0.0046 Data Summary Groups N Mean Std. Dev. Std. Error Group 1 W 3.9333 0.4619
Data from problem #1
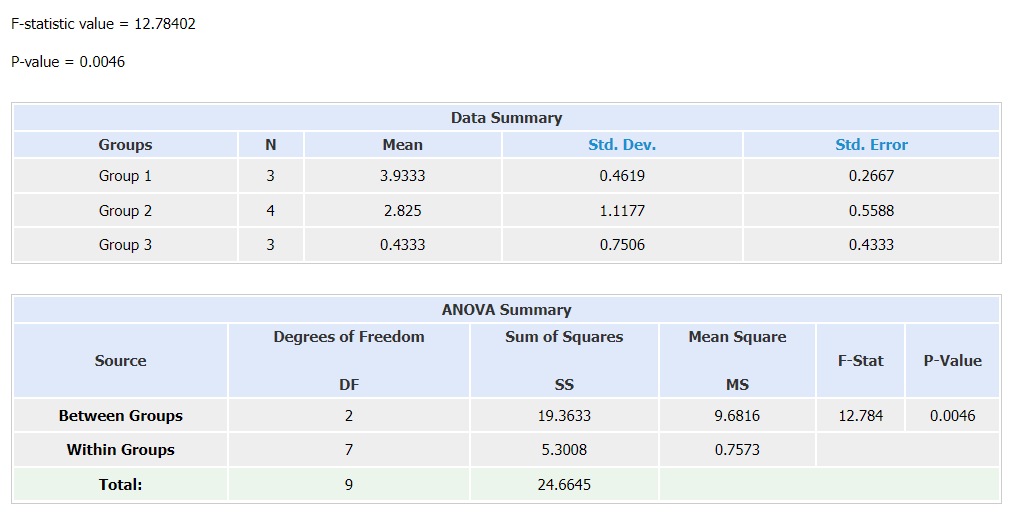
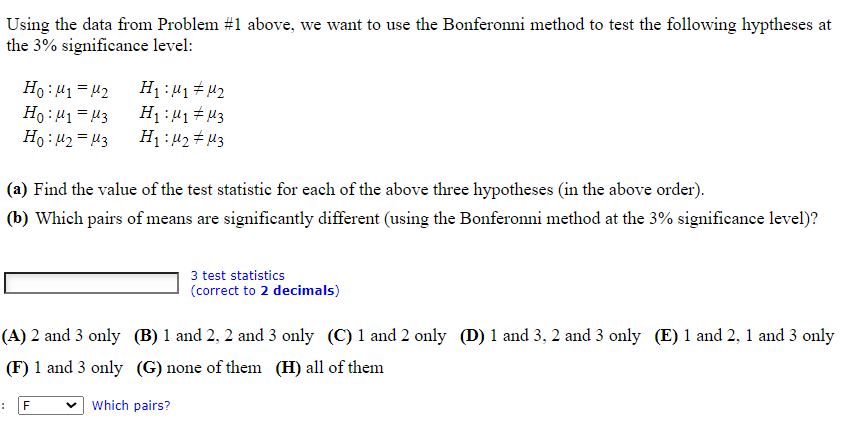
F-statistic value = 12.78402 P-value = 0.0046 Data Summary Groups N Mean Std. Dev. Std. Error Group 1 W 3.9333 0.4619 0.2667 Group 2 4 2.825 1.1177 0.5588 Group 3 3 0.4333 0.7506 0.4333 ANOVA Summary Degrees of Freedom Sum of Squares Mean Square Source F-Stat P-Value DF SS MS Between Groups 2 19.3633 9.6816 12.784 0.0046 Within Groups 7 5.3008 0.7573 Total: 9 24.6645Using the data from Problem #1 above, we want to use the Bonferonni method to test the following hyptheses at the 3% significance level: Ho : M1 = H2 H1 : M1 7 /2 Ho : M1 = M3 Ho : M2 = M3 H1 : 12 F M3 (a) Find the value of the test statistic for each of the above three hypotheses (in the above order). (b) Which pairs of means are significantly different (using the Bonferonni method at the 3% significance level)? 3 test statistics (correct to 2 decimals) (A) 2 and 3 only (B) 1 and 2, 2 and 3 only (C) 1 and 2 only (D) 1 and 3, 2 and 3 only (E) 1 and 2, 1 and 3 only (F) 1 and 3 only (G) none of them (H) all of them F v Which pairs
Step by Step Solution
There are 3 Steps involved in it

Get step-by-step solutions from verified subject matter experts