

Question: Data from the 2002 and 2004 surveys are summarized in this two-way table: 2002 2004 Donated blood in previous 12 months 210 230 Did not

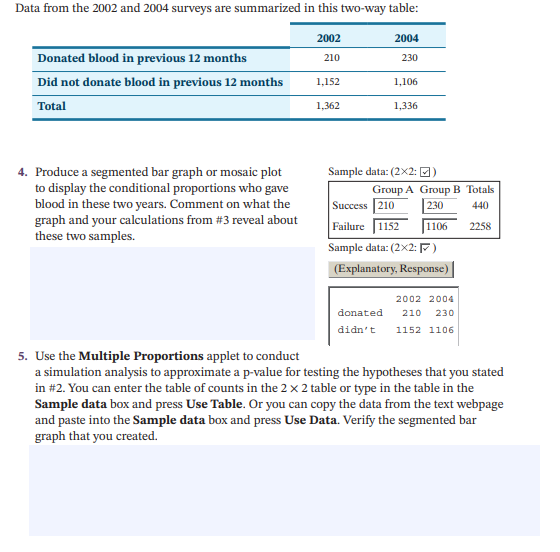
Data from the 2002 and 2004 surveys are summarized in this two-way table: 2002 2004 Donated blood in previous 12 months 210 230 Did not donate blood in previous 12 months 1,152 1,106 Total 1,362 1,336 4. Produce a segmented bar graph or mosaic plot Sample data: (2X2: ]) to display the conditional proportions who gave Group A Group B Totals blood in these two years. Comment on what the Success 210 230 440 graph and your calculations from #3 reveal about Failure 1152 1106 2258 these two samples. Sample data: (2X2: [ ) (Explanatory, Response) 2002 2004 donated 210 230 didn't 1152 1106 5. Use the Multiple Proportions applet to conduct a simulation analysis to approximate a p-value for testing the hypotheses that you stated in #2. You can enter the table of counts in the 2 x 2 table or type in the table in the Sample data box and press Use Table. Or you can copy the data from the text webpage and paste into the Sample data box and press Use Data. Verify the segmented bar graph that you created
Step by Step Solution
There are 3 Steps involved in it

Get step-by-step solutions from verified subject matter experts