

Question: Data from the case and Exhibits has been entered into the boxes below. To facilitate your calculations and analysis, reorganize the data into information related
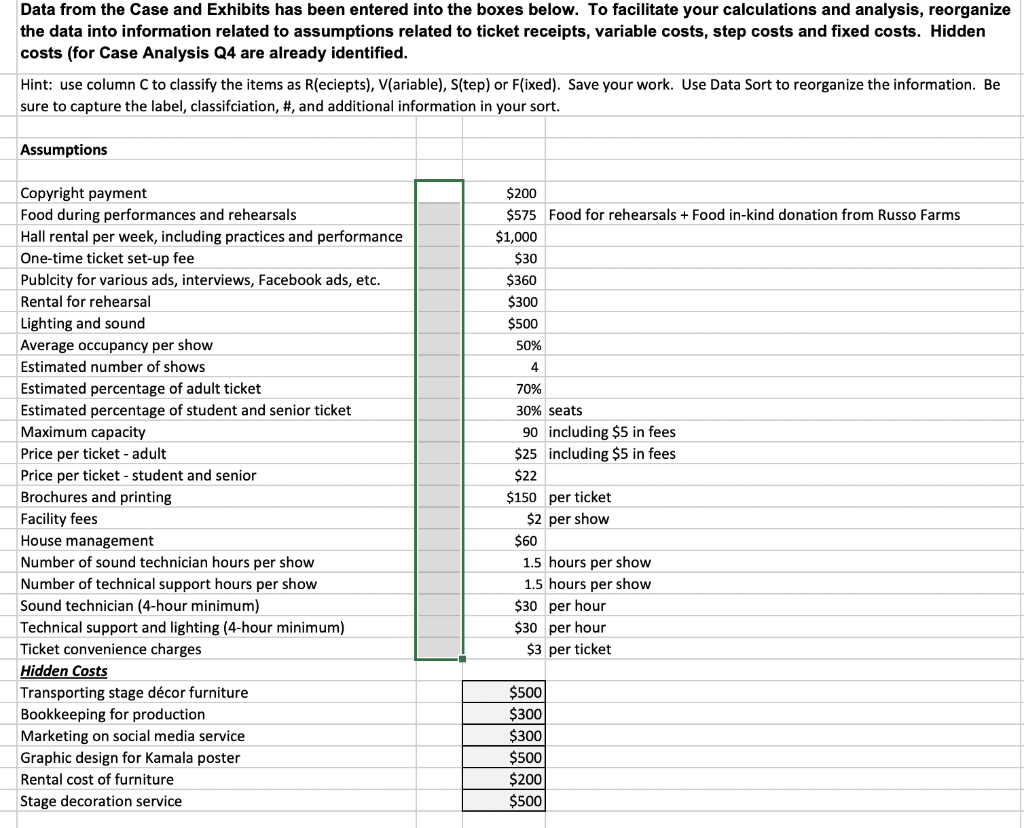
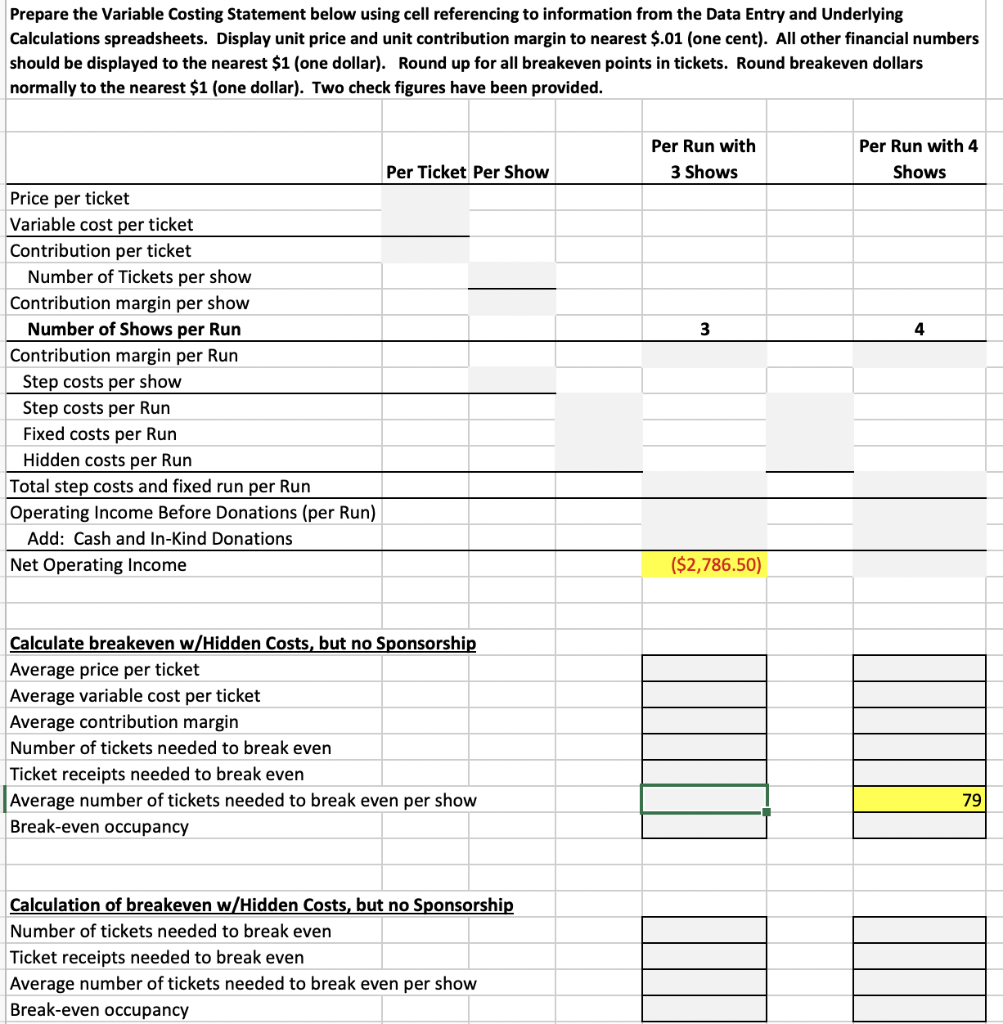
Data from the case and Exhibits has been entered into the boxes below. To facilitate your calculations and analysis, reorganize the data into information related to assumptions related to ticket receipts, variable costs, step costs and fixed costs. Hidden costs (for Case Analysis Q4 are already identified. Hint: use column C to classify the items as Reciepts), Variable), Step) or Fixed). Save your work. Use Data Sort to reorganize the information. Be sure to capture the label, classifciation, #, and additional information in your sort. Assumptions $200 $575 Food for rehearsals + Food in-kind donation from Russo Farms $1,000 $30 $360 $300 $500 50% Copyright payment Food during performances and rehearsals Hall rental per week, including practices and performance One-time ticket set-up fee Publcity for various ads, interviews, Facebook ads, etc. Rental for rehearsal Lighting and sound Average occupancy per show Estimated number of shows Estimated percentage of adult ticket Estimated percentage of student and senior ticket Maximum capacity Price per ticket - adult Price per ticket - student and senior Brochures and printing Facility fees House management Number of sound technician hours per show Number of technical support hours per show Sound technician (4-hour minimum) Technical support and lighting (4-hour minimum) Ticket convenience charges Hidden Costs Transporting stage dcor furniture Bookkeeping for production Marketing on social media service Graphic design for Kamala poster Rental cost of furniture Stage decoration service 70% 30% seats 90 including $5 in fees $25 including $5 in fees $22 $150 per ticket $2 per show $60 1.5 hours per show 1.5 hours per show $30 per hour $30 per hour $3 per ticket $500 $300 $300 $500 $200 $500 Prepare the Variable Costing Statement below using cell referencing to information from the Data Entry and Underlying Calculations spreadsheets. Display unit price and unit contribution margin to nearest $.01 (one cent). All other financial numbers should be displayed to the nearest $1 (one dollar). Round up for all breakeven points in tickets. Round breakeven dollars normally to the nearest $1 (one dollar). Two check figures have been provided. Per Run with 3 Shows Per Run with 4 Shows 3 Per Ticket Per Show Price per ticket Variable cost per ticket Contribution per ticket Number of Tickets per show Contribution margin per show Number of Shows per Run Contribution margin per Run Step costs per show Step costs per Run Fixed costs per Run Hidden costs per Run Total step costs and fixed run per Run Operating Income Before Donations (per Run) Add: Cash and In-Kind Donations Net Operating Income ($2,786.50) Calculate breakeven w/Hidden Costs, but no Sponsorship Average price per ticket Average variable cost per ticket Average contribution margin Number of tickets needed to break even Ticket receipts needed to break even Average number of tickets needed to break even per show Break-even occupancy 79 Calculation of breakeven w/Hidden Costs, but no Sponsorship Number of tickets needed to break even Ticket receipts needed to break even Average number of tickets needed to break even per show Break-even occupancy
Step by Step Solution
There are 3 Steps involved in it

Get step-by-step solutions from verified subject matter experts