

Question: Data from the Office for National Statistics show that the mean age at which men in Great Britain get married was 33.5. A news reporter
Data from the Office for National Statistics show that the mean age at which men in Great Britain get married was 33.5. A news reporter noted that this represents a continuation of the trend of waiting until a later age to wed. A new sample of 47 recently wed British men provided their age at the time of marriage.
These data are contained in the Excel Online file below. Construct a spreadsheet to answer the following questions.
(PLEASEE SEE EXCEL WITH DATA ATTACHED)
?
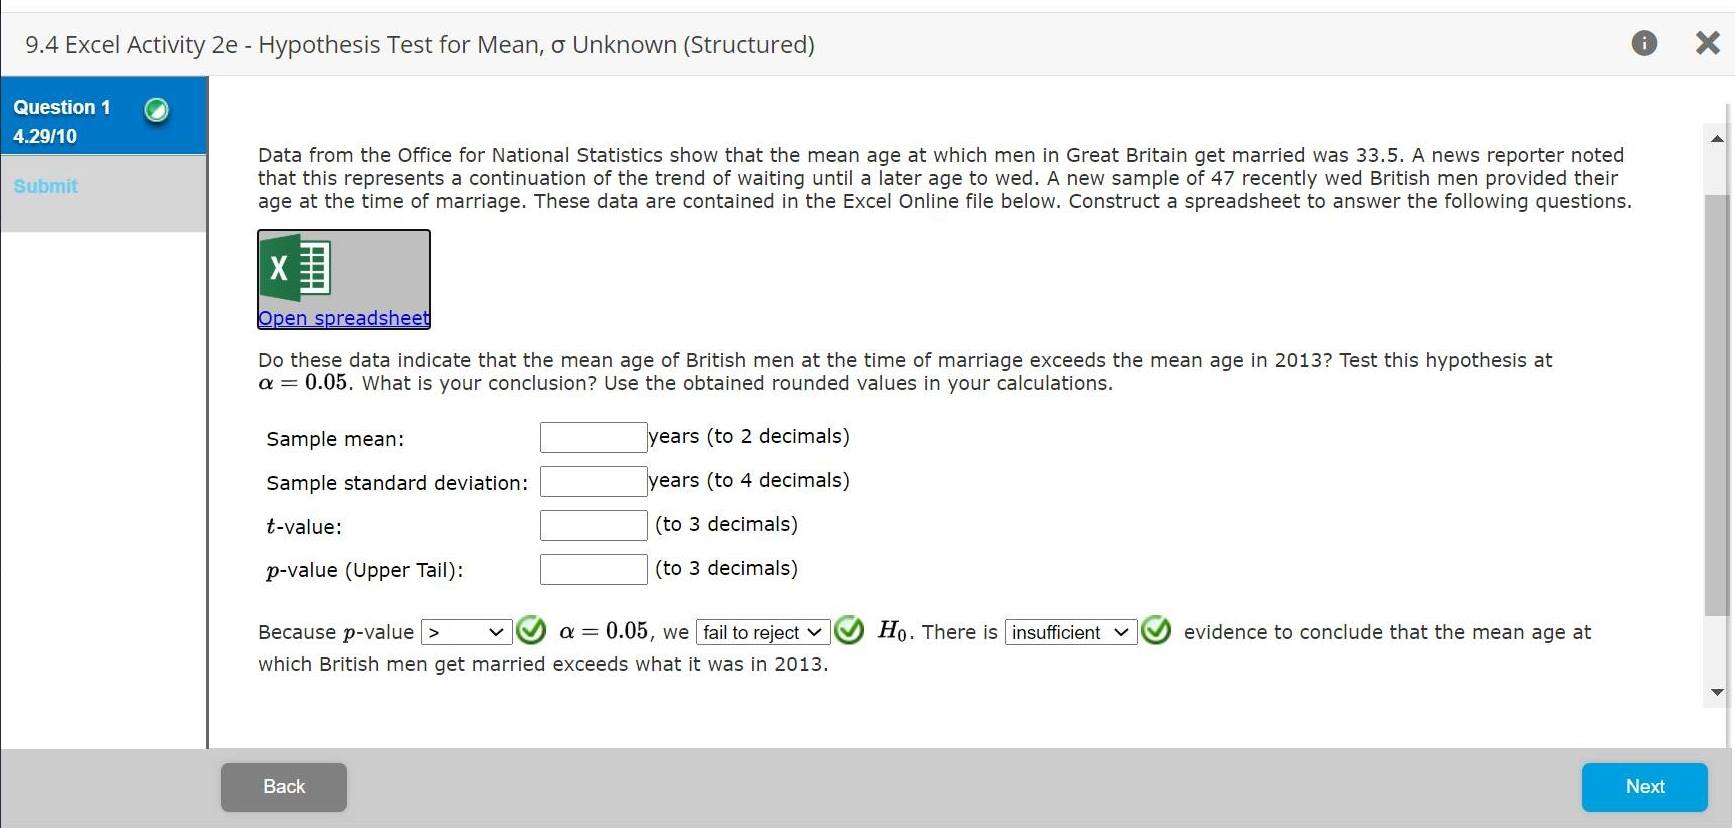
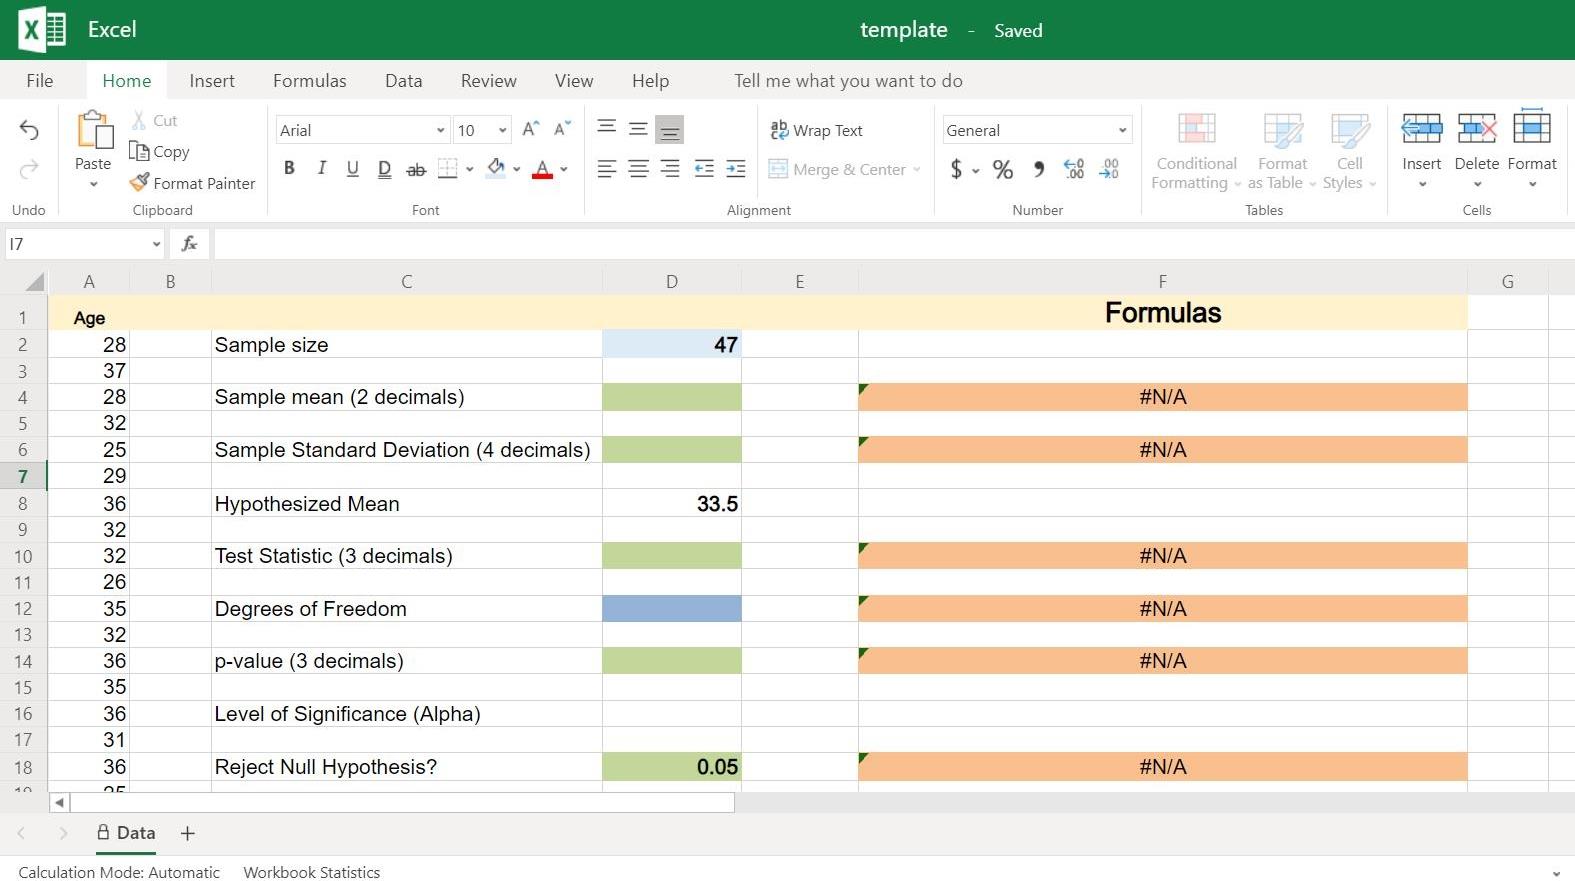
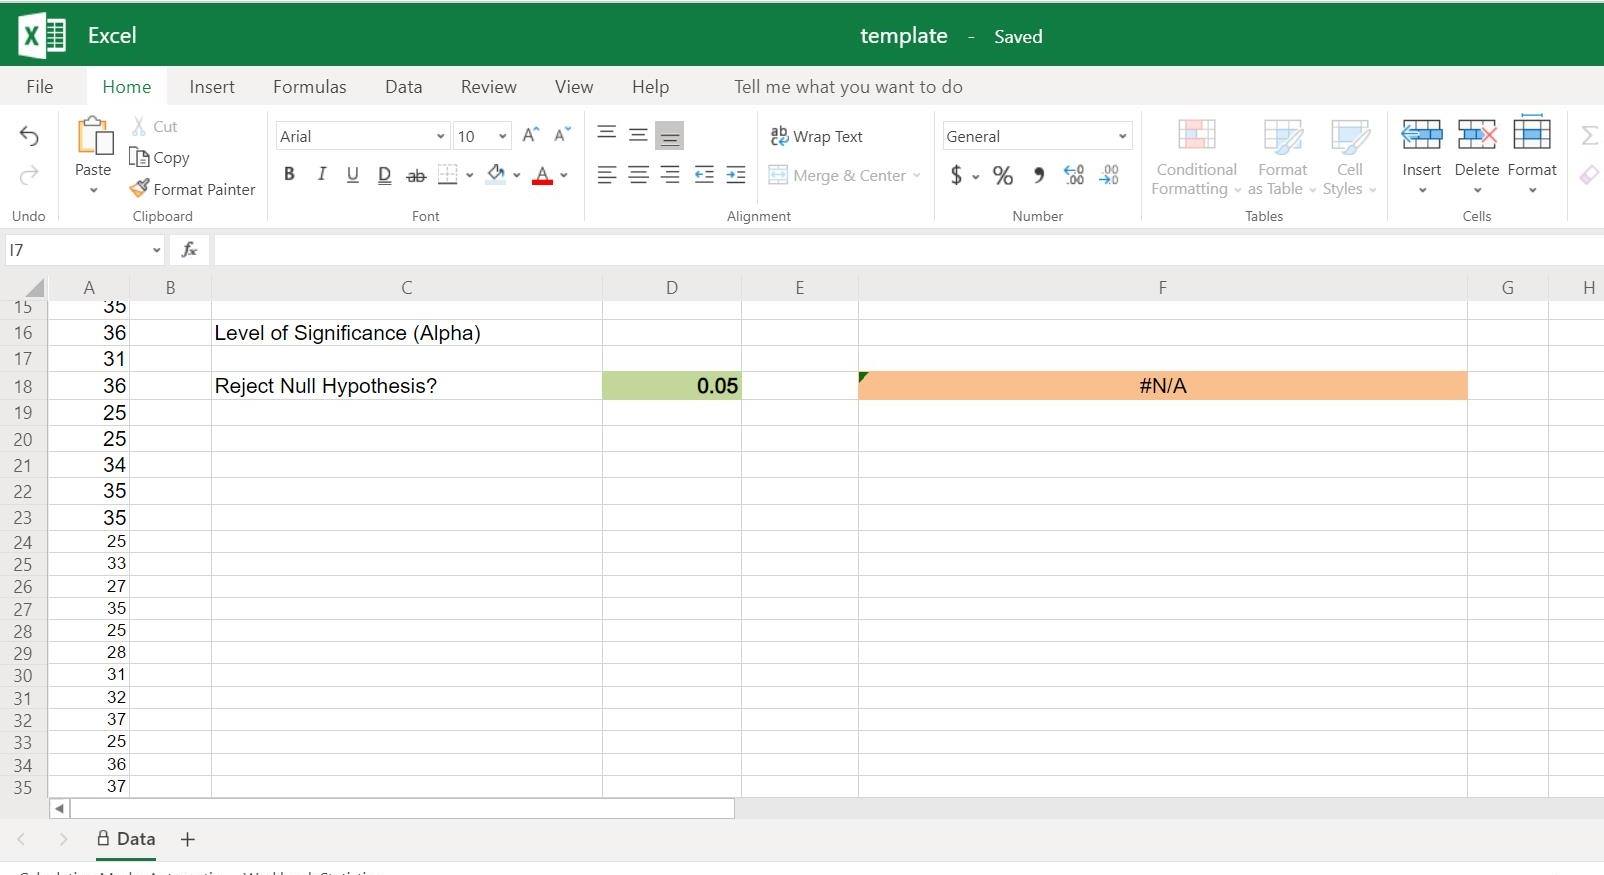
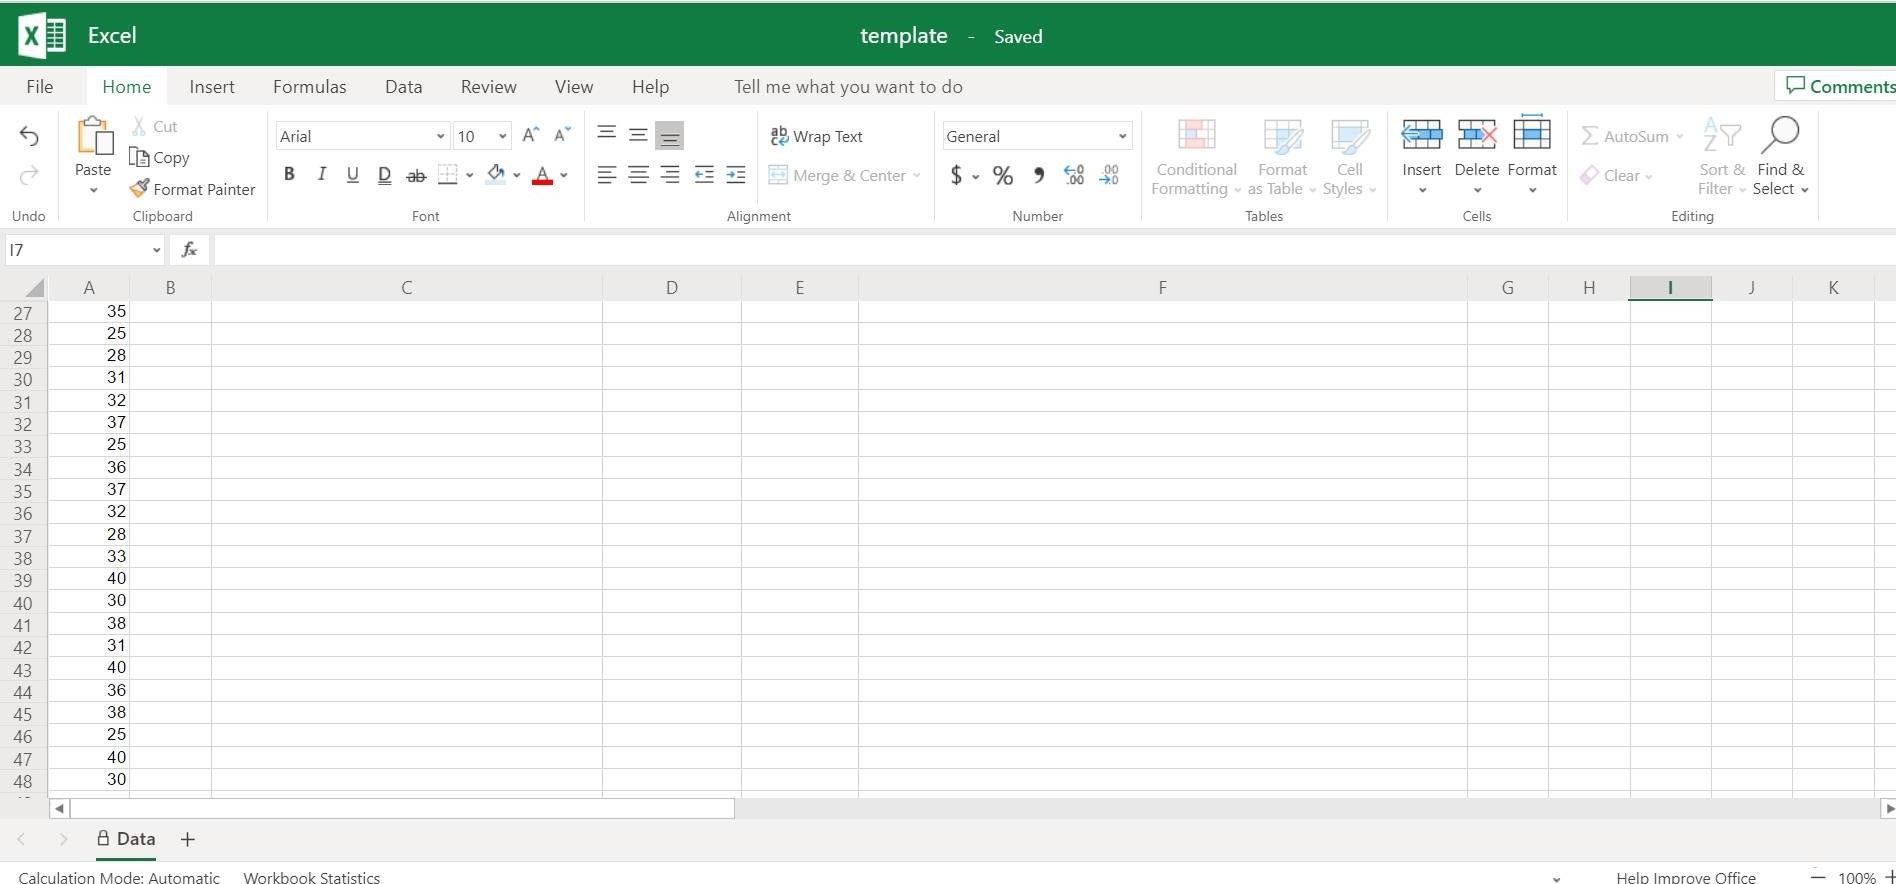
9.4 Excel Activity 2e Hypothesis Test for Mean, 0 Unknown (Structured) 0 x Question 1 '4] 4.29MB .& Data from the Ofce for National Statistics show that the mean age at which men in Great Britain get married was 33.5. A news reporter noted that this represents a continuation of the trend of waiting until a later age to wed. A new sample of 47 recently wed British men provided their age at the time of marriage. These data are contained in the Excel Onli'ne le below. Construct a spreadsheet to answer the following questions. XE Do these data indicate that the mean age of British men at the time of marriage exceeds the mean age in 2013? Test this hypothesis at a = 0.05, What is your conclusion? Use the obtained rounded values in your calculations. Sample mean: lyears (to 2 decimals) Sample standard deviation: years (to 4 decimals) tvalue: (to 3 decimals) pvalue (Upper Tail): (to 3 decimals) Because p-value _@ a = 0.95, we @ Ho. There is _@ evidence to conclude that the mean age at which British men get married exceeds. what it was in 2013. X Excel template Saved File Home Insert Formulas Data Review View Help Tell me what you want to do X. Cut Arial 10 AA ae Wrap Text General Paste [B Copy BIUDab ~ ~ A Merge & Center ~ $ ~ % 9 68 Conditional Format Cell Insert Delete Format Format Painter Formatting ~ as Table . Styles ~ Undo Clipboard Font Alignment Number Tables Cells 17 fx A B C D E F G Age Formulas 28 Sample size 47 w 37 NOUD 28 Sample mean (2 decimals) #N/A 32 25 Sample Standard Deviation (4 decimals) #N/A 29 36 Hypothesized Mean 33.5 32 10 32 Test Statistic (3 decimals) #N/A 11 26 12 35 Degrees of Freedom #N/A 13 32 14 36 p-value (3 decimals) #N/A 15 35 16 36 Level of Significance (Alpha) 17 31 18 36 Reject Null Hypothesis? 0.05 #N/A
Step by Step Solution
There are 3 Steps involved in it

Get step-by-step solutions from verified subject matter experts