

Question: Data from the U . S . Shopper Database provided the following percentages for women shopping at each of the various outlets table [
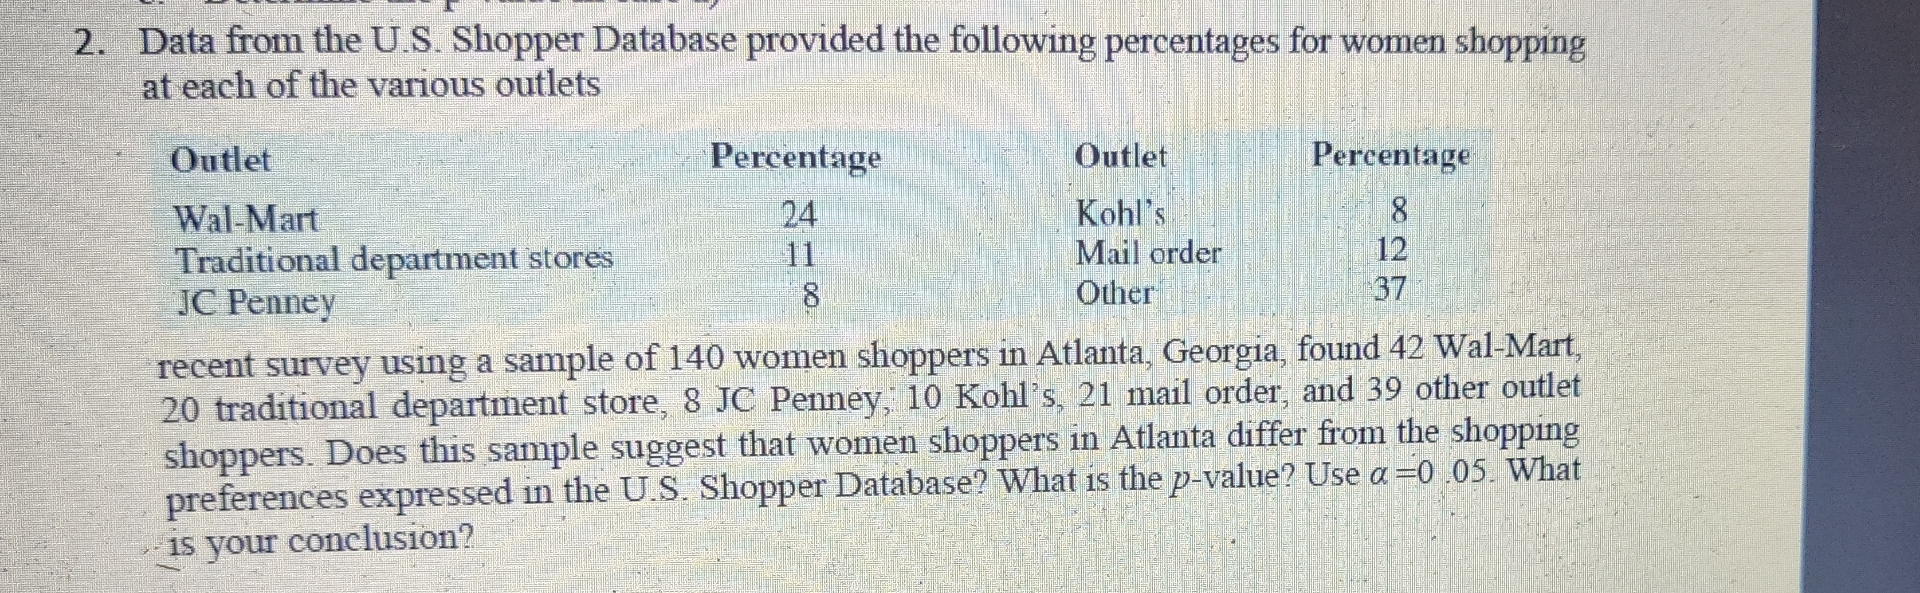
Data from the US Shopper Database provided the following percentages for women shopping at each of the various outlets
tableOutletPercentage,Outlet,PercentageWalMart,Kohl's,Traditional department stores,Mail order,JC Penney,Other,
recent survey using a sample of women shoppers in Atlanta, Georgia, found WalMart, traditional department store, JC Penney; Kohl's, mail order, and other outlet shoppers. Does this sample suggest that women shoppers in Atlanta differ from the shopping preferences expressed in the US Shopper Database? What is the value? Use What is your conclusion?
Step by Step Solution
There are 3 Steps involved in it
1 Expert Approved Answer
Step: 1 Unlock

Question Has Been Solved by an Expert!
Get step-by-step solutions from verified subject matter experts
Step: 2 Unlock
Step: 3 Unlock