

Question: data from the U.S. Census Bureau to produc Lorenz curves for the distribution of U.S. income in 1935 and in 1947: ulator er the street

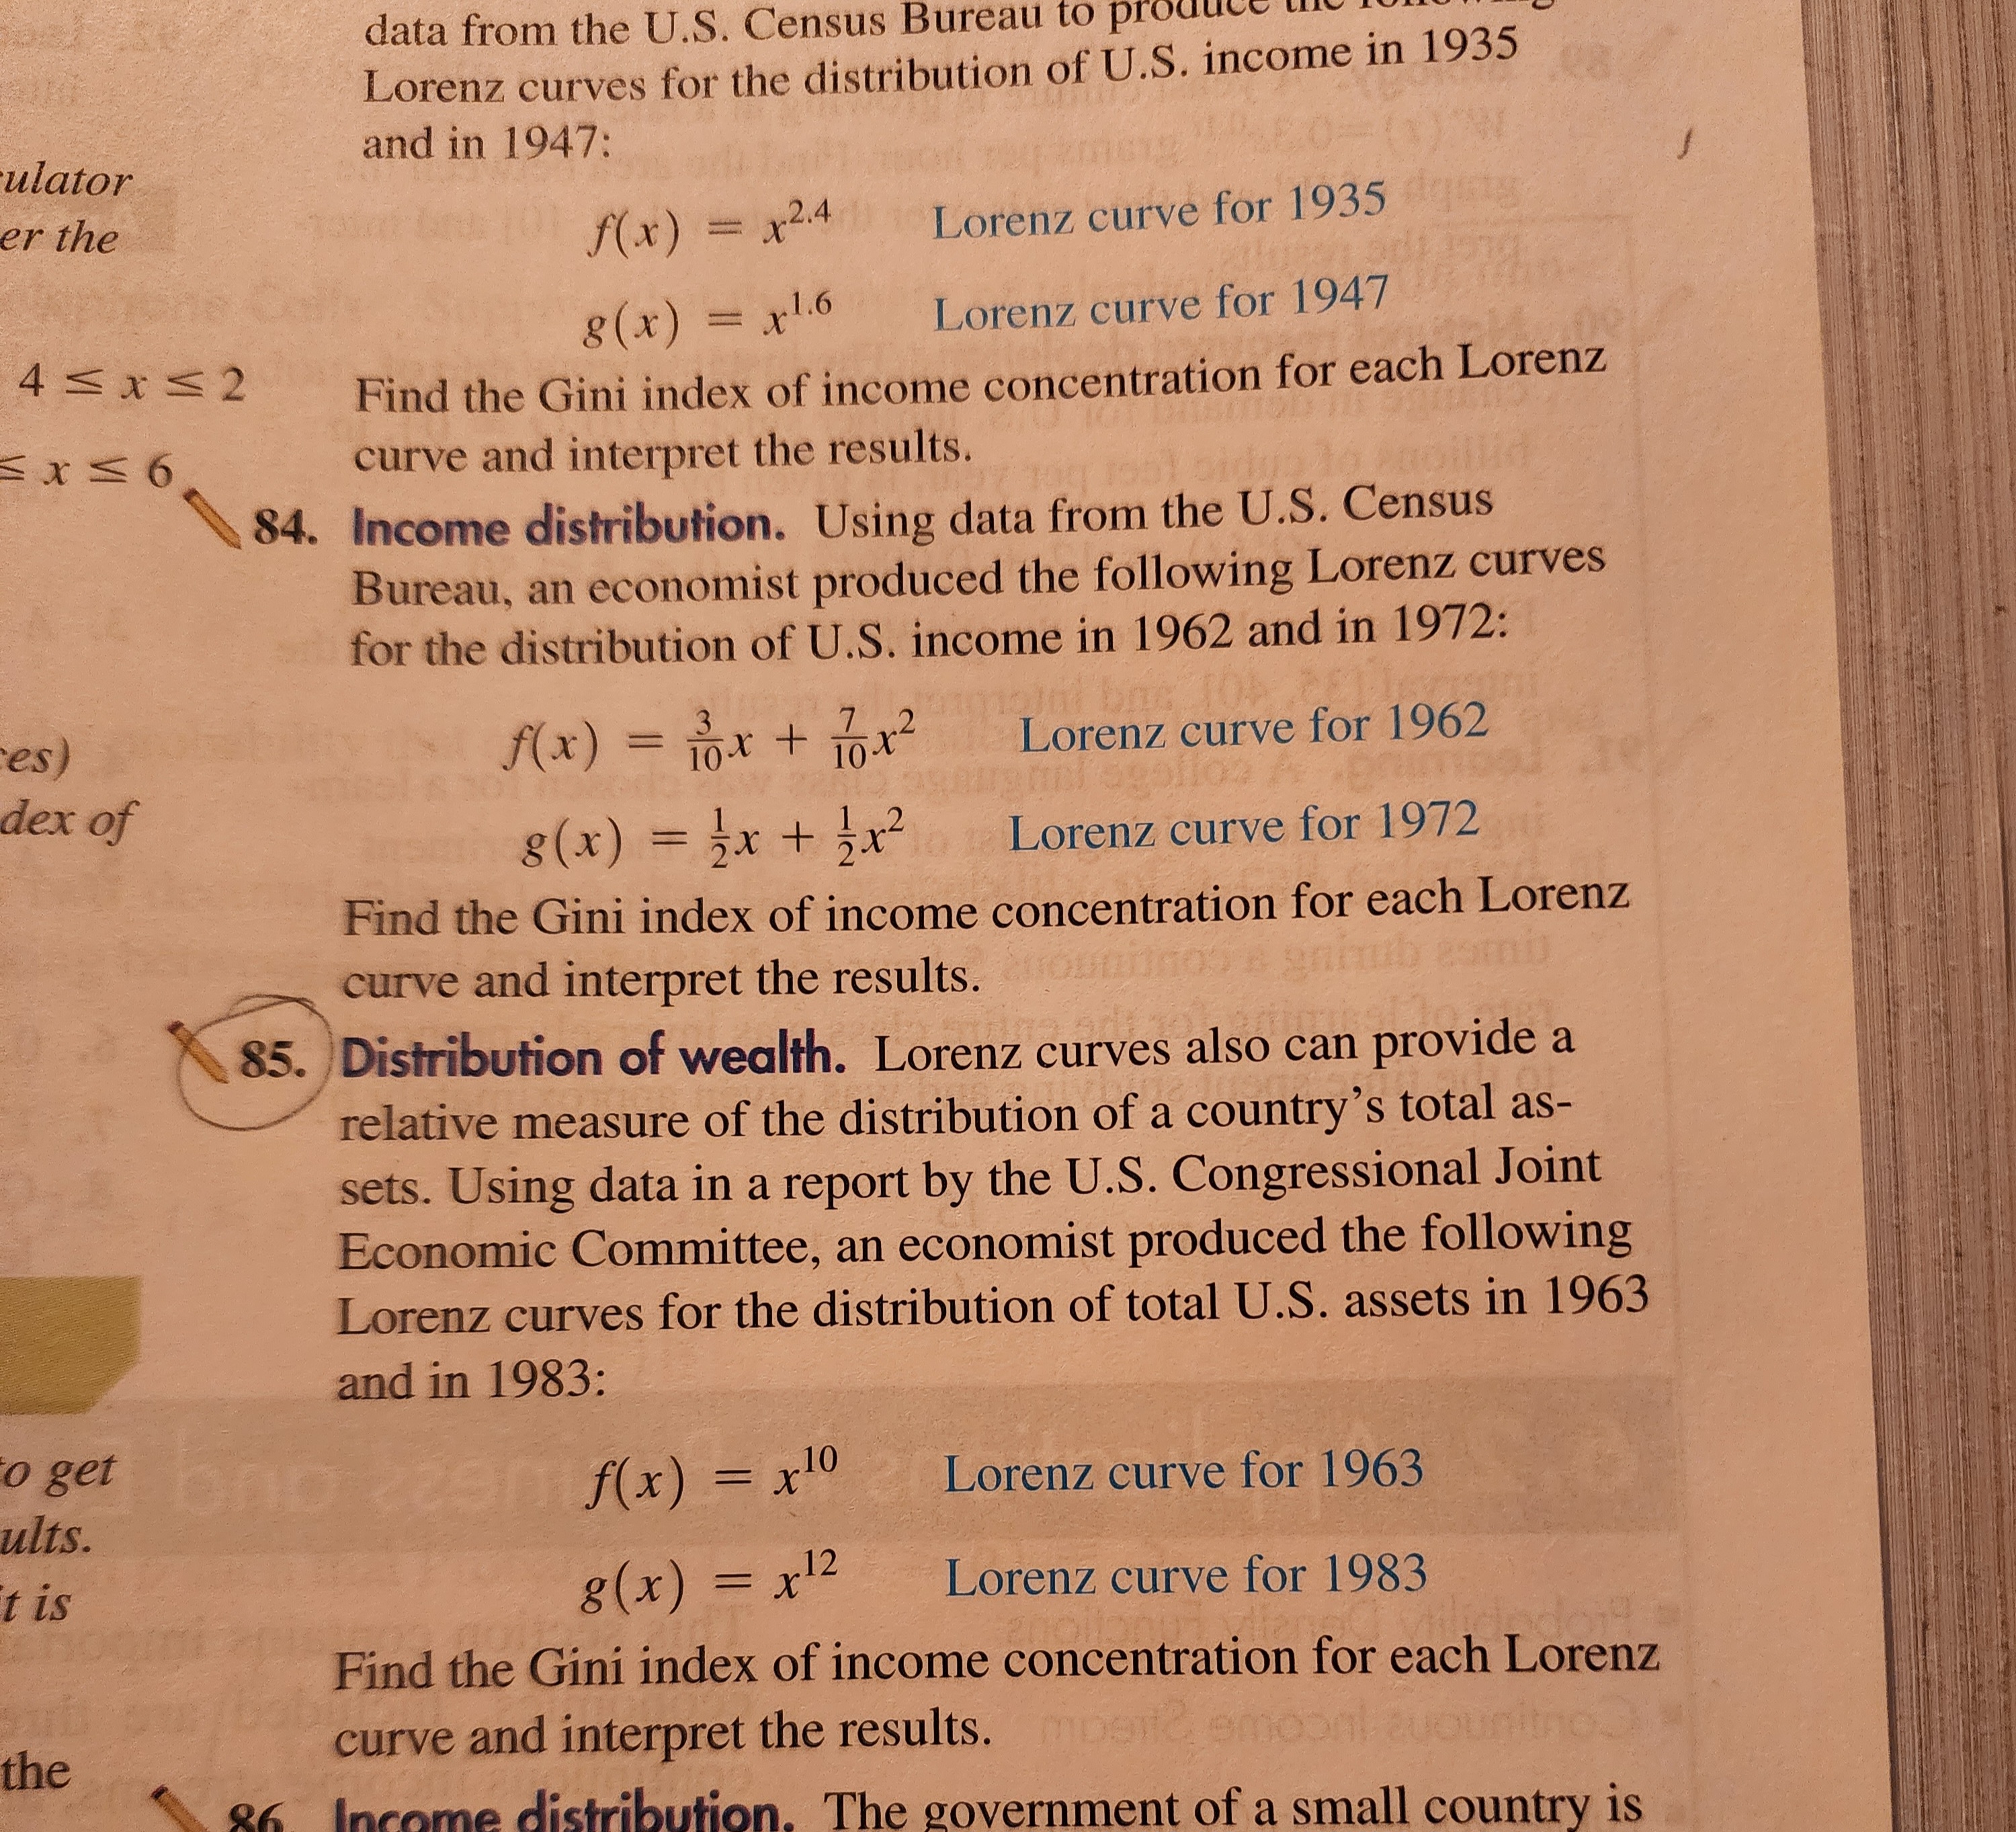
data from the U.S. Census Bureau to produc Lorenz curves for the distribution of U.S. income in 1935 and in 1947: ulator er the street to f(x) = x24 Lorenz curve for 1935 8 (x ) = *16 Lorenz curve for 1947 4 5x52 Find the Gini index of income concentration for each Lorenz Ex-6 curve and interpret the results. 84. Income distribution. Using data from the U.S. Census Bureau, an economist produced the following Lorenz curves for the distribution of U.S. income in 1962 and in 1972: es) f(x) = 10* + 10x2 Lorenz curve for 1962 dex of 8(x) = zx+ 2x2 Lorenz curve for 1972 Find the Gini index of income concentration for each Lorenz curve and interpret the results. 85. Distribution of wealth. Lorenz curves also can provide a relative measure of the distribution of a country's total as- sets. Using data in a report by the U.S. Congressional Joint Economic Committee, an economist produced the following Lorenz curves for the distribution of total U.S. assets in 1963 and in 1983: o get f(x) = x Lorenz curve for 1963 ults. t is 8 (x ) = x12 Lorenz curve for 1983 Find the Gini index of income concentration for each Lorenz the curve and interpret the results. momunite 86 Income distribution. The government of a small country is
Step by Step Solution
There are 3 Steps involved in it

Get step-by-step solutions from verified subject matter experts