

Question: Data (given) Sales Price $106 per unit Variable Costs $46 per unit Fixed Cost $660 Excel Formulas Contribution Margin per unit Break-Even Point units Data
| Data (given) | |||||||||||
| Sales Price | $106 | per unit | |||||||||
| Variable Costs | $46 | per unit | |||||||||
| Fixed Cost | $660 | ||||||||||
| Excel Formulas | |||||||||||
| Contribution Margin | per unit | ||||||||||
| Break-Even Point | units | ||||||||||
| Data Table | |||||||||||
| Use the data and calculations above to create a data table below that will be used to graph of costs, profits and volume. | |||||||||||
| Units | Costs | Gross Revenue | Profit | ||||||||
| 1 | |||||||||||
| 2 | |||||||||||
| 3 | |||||||||||
| 4 | |||||||||||
| 5 | |||||||||||
| 6 | |||||||||||
| 7 | |||||||||||
| 8 | |||||||||||
| 9 | |||||||||||
| 10 | |||||||||||
| 11 | |||||||||||
| 12 | |||||||||||
| 13 | |||||||||||
| 14 | |||||||||||
| 15 | |||||||||||
| 16 | |||||||||||
| 17 | |||||||||||
| 18 | |||||||||||
| 19 | |||||||||||
| 20 | |||||||||||
| 21 | |||||||||||
| 22 | |||||||||||
| 23 | |||||||||||
| 24 | |||||||||||
| 25 | |||||||||||
| 26 | |||||||||||
| 27 | |||||||||||
| 28 | |||
| 29 | |||
| 30 |
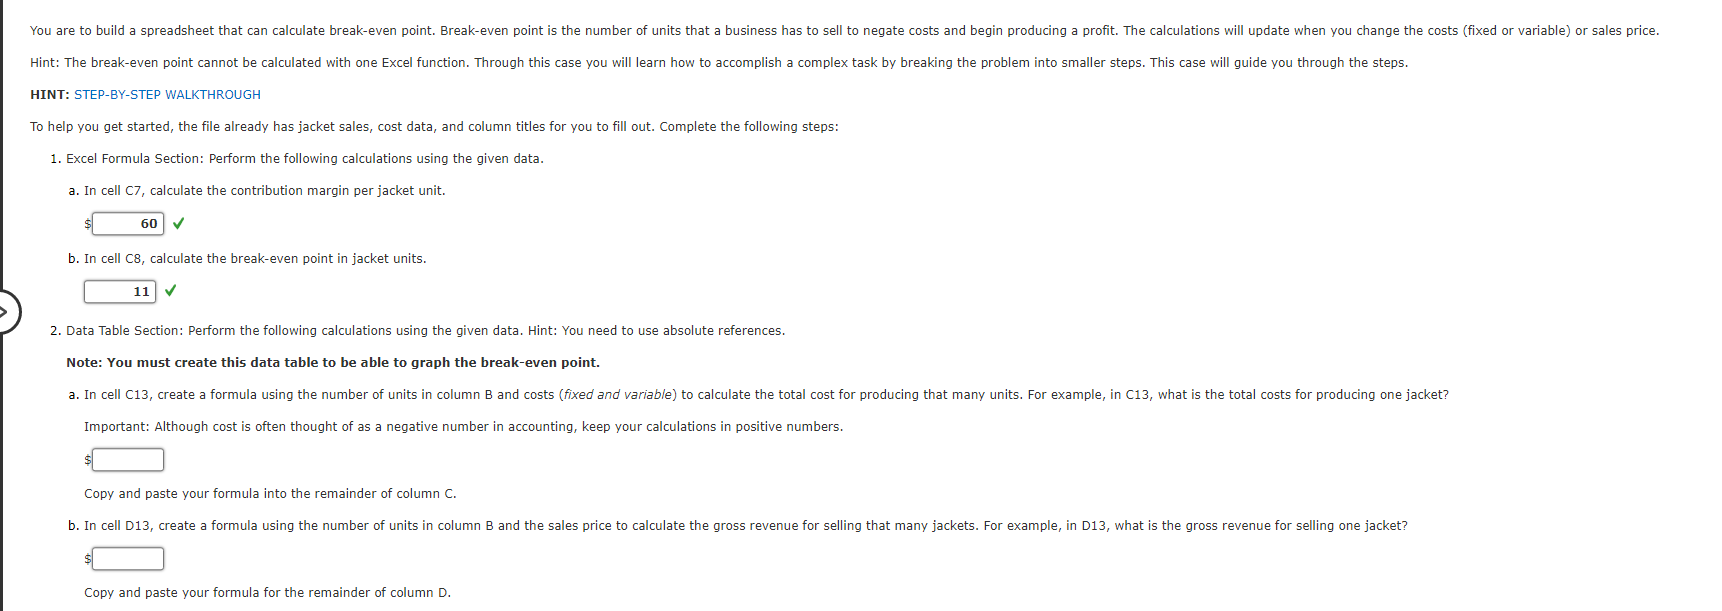
HINT: STEP-BY-STEP WALKTHROUGH To help you get started, the file already has jacket sales, cost data, and column titles for you to fill out. Complete the following steps: 1. Excel Formula Section: Perform the following calculations using the given data. a. In cell C7, calculate the contribution margin per jacket unit. b. In cell C8, calculate the break-even point in jacket units. 2. Data Table Section: Perform the following calculations using the given data. Hint: You need to use absolute references. Note: You must create this data table to be able to graph the break-even point. Important: Although cost is often thought of as a negative number in accounting, keep your calculations in positive numbers. Copy and paste your formula into the remainder of column C. Copy and paste your formula for the remainder of column D
Step by Step Solution
There are 3 Steps involved in it

Get step-by-step solutions from verified subject matter experts