Question: Data has come in from the collection effort. Like many initiatives carried out in business, the data provided to your team came from another department
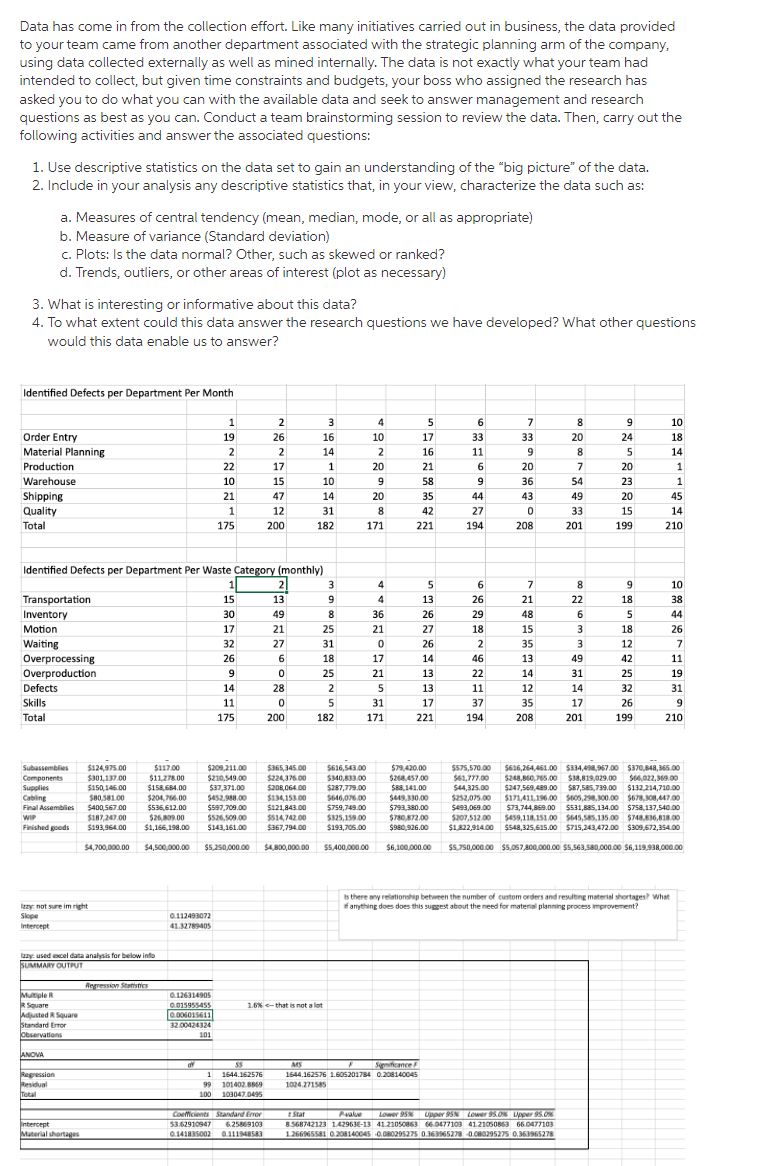
Data has come in from the collection effort. Like many initiatives carried out in business, the data provided to your team came from another department associated with the strategic planning arm of the company, using data collected externally as well as mined internally. The data is not exactly what your team had intended to collect, but given time constraints and budgets, your boss who assigned the research has asked you to do what you can with the available data and seek to answer management and research questions as best as you can. Conduct a team brainstorming session to review the data. Then, carry out the following activities and answer the associated questions: 1. Use descriptive statistics on the data set to gain an understanding of the "big picture" of the data. 2. Include in your analysis any descriptive statistics that, in your view, characterize the data such as: a. Measures of central tendency (mean, median, mode, or all as appropriate) b. Measure of variance (Standard deviation) c. Plots: Is the data normal? Other, such as skewed or ranked? d. Trends, outliers, or other areas of interest (plot as necessary) 3. What is interesting or informative about this data? 4. To what extent could this data answer the research questions we have developed? What other questions would this data enable us to answer? Identified Defects per Department Per Month 1 2 3 4 5 6 7 8 9 10 Order Entry 19 16 10 17 33 33 24 18 Material Planning 2 2 14 2 16 11 9 5 14 Production 17 1 20 21 6 20 20 1 Warehouse 15 10 9 58 9 36 23 1 Shipping 47 14 20 35 43 20 45 Quality 1 12 31 42 0 15 14 Total 175 200 182 221 208 199 210 Identified Defects per Department Per Waste Category (monthly) 1 2 3 5 7 9 10 Transportation 15 13 9 13 21 18 38 Inventory 30 49 26 48 5 44 Motion 17 21 27 15 18 26 32 Waiting 27 26 35 12 7 26 14 46 13 49 42 11 Overprocessing Overproduction 9 13 22 14 31 25 19 Defects 14 13 11 12 14 32 31 Skills 11 17 37 35 17 26 9 Total 175 200 221 194 208 201 199 210 $117.00 $209,211.00 $365,345.00 $616,543.00 $79,420.00 $268,457.00 Subassemblies Components Supplies Cabling $11,278.00 $158,684.00 2304200 $210,549.00 $224,376.00 $340,833.00 $37,371.00 $287,779.00 $88,141.00 $208,064.00 $136.15 $204,766.00 $452,988.00 $646,076.00 $449,330,00 $575,570.00 $616,264,461.00 $334,498,967.00 $370,848,365.00 $61,777.00 $248,860,765.00 $38,819,029.00 $66,022,369.00 $44,325.00 $247,569,489.00 $87,585,739.00 $132,214,710.00 $252,075.00 $171,411,196.00 $605,298,300.00 $678,308,447.00 $493,069.00 $73,744,869.00 $531,885,134.00 $758,137,540.00 $207,512.00 $459,118,151.00 $645,585,135.00 $748,836,818.00 $1,822,914.00 $548,325,615.00 $715,243,472.00 $309,672,354.00 $597,709.00 $121,843.00 $759,749.00 $793,380.00 Final Assemblies WIP Finished goods $536,612.00 $26.809.00 $526,509.00 $514,742.00 $325,159.00 $780.872.00 $980,926.00 $1,166,198.00 $143,161.00 $367,794.00 $193,705.00 $4,500,000.00 $5,250,000.00 $4,800,000.00 $5,400,000.00 $6,100,000.00 $5,750,000.00 $5,057,800,000.00 $5,563,580,000.00 $6,119,938,000.00 Is there any relationship between the number of custom orders and resulting material shortages? What anything does does this suggest about the need for material planning process improvement? Izzy: not sure im right Slope 0.112493072 41.32789405 Intercept lazy: used excel data analysis for below info SUMMARY OUTPUT Regression Statistics 0.126314905 Multiple R Square Adjusted R Square 0.015955455 0.006015611 32.00424324 101 Standard Error Observations ANOVA Off Regression Residual Total Intercept Material shortages $124,975.00 $301,137.00 $150,146.00 $80,581.00 $400,567.00 $187,247.00 $193,964.00 $4,700,000.00 22 10 21 26 55 1 1644.162576 99 101402.8869 100 103047.0495 Coefficients Standard Error 53.62910947 6.25869103 0.141835002 0.111948583 6 0 28 0 8 25 31 18 25 2 5 182 8 171 4 4 36 21 0 17 21 5 31 171 44 27 194 6 26 29 18 2 1.6%


