

Question: DATA in Data point number: N Volume reading at bottom of O O O tube (in degree units) Volume reading at top of air Con
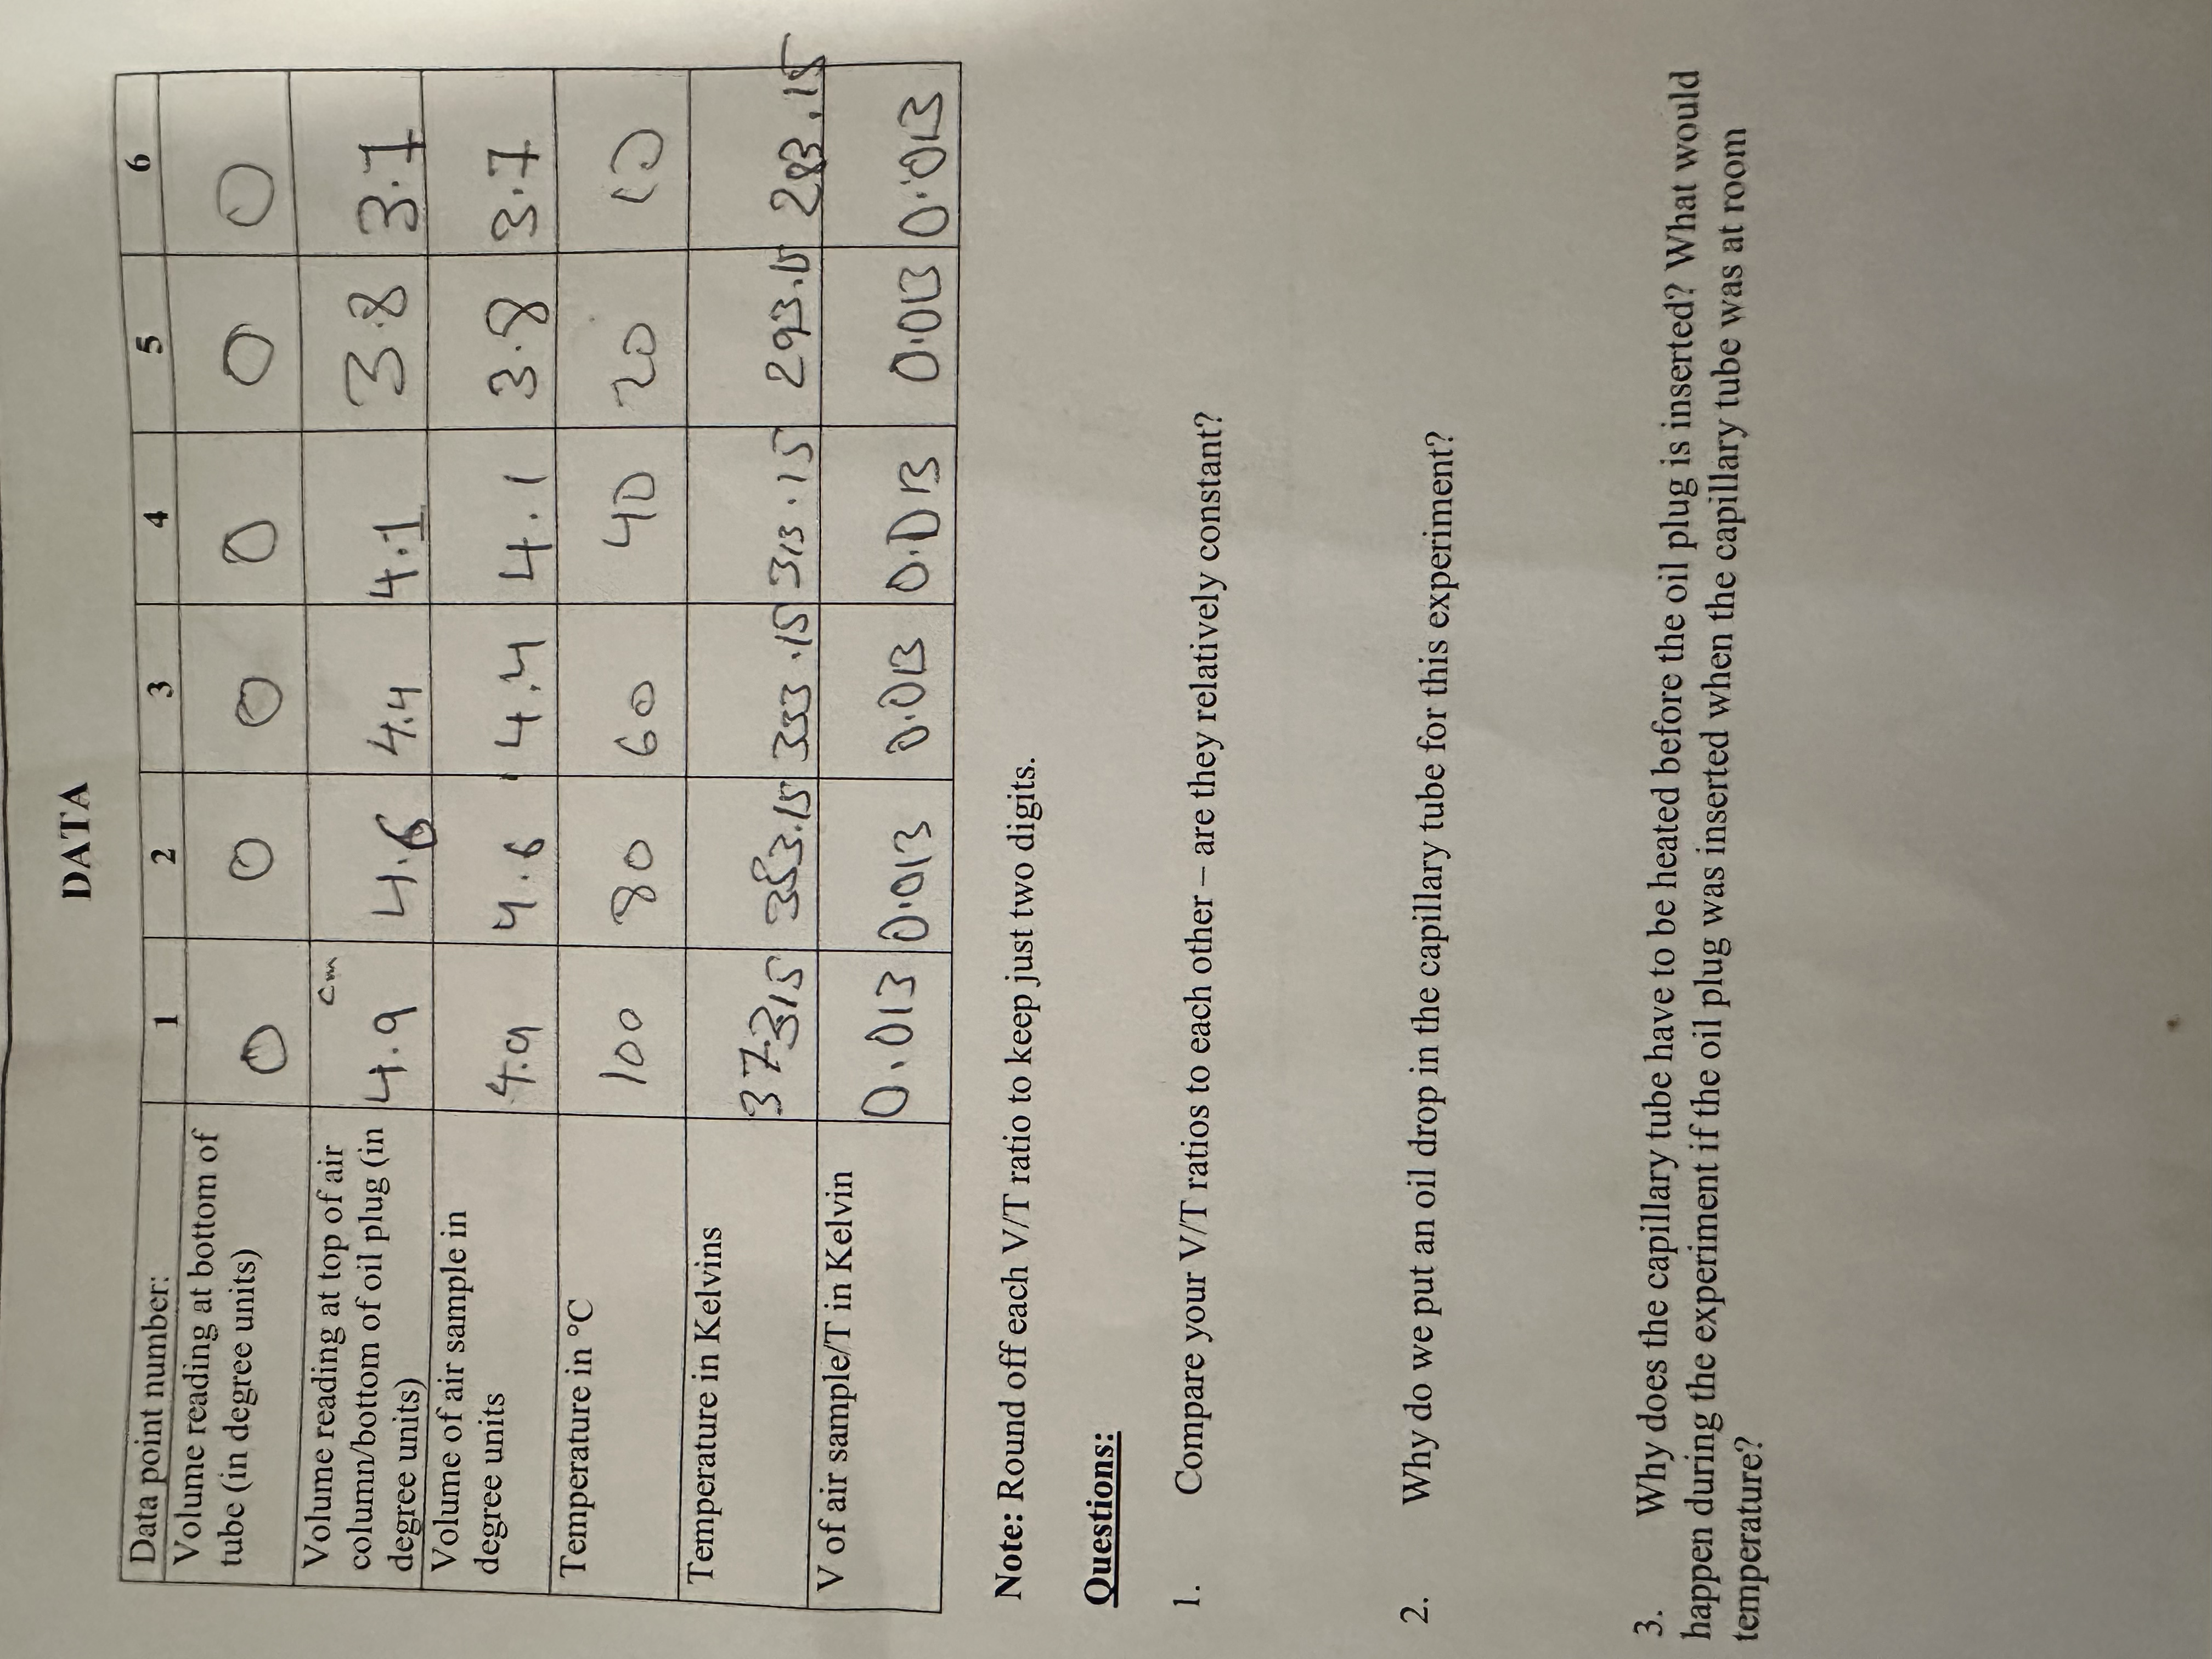
DATA in Data point number: N Volume reading at bottom of O O O tube (in degree units) Volume reading at top of air Con column/bottom of oil plug (in . q 3.8 3.1 degree units) 4.4 Volume of air sample in degree units 4. 9 4. 6 14. 4 4 . 1 3.8 / 3 . 7 Temperature in C 100 80 60 40 / 20 Temperature in Kelvins 137:315 383.15 353 15 313. 15 293. 0 283,15 V of air sample/T in Kelvin 0. 013 0.013 / 0.013 /0.D 13 0.013 0:013 Note: Round off each V/T ratio to keep just two digits. Questions: Compare your V/T ratios to each other - are they relatively constant? Why do we put an oil drop in the capillary tube for this experiment? Why does the capillary tube have to be heated before the oil plug is inserted? What would happen during the experiment if the oil plug was inserted when the capillary tube was at room temperature?On the graph paper provided, make a graph of volume vs, temperature in Kelvins for the trapped air sample. Refer to the guidelines on graphing given in Experiment 6. Draw the best straight line among the points, Make another graph of volume vs. temperature, this time starting the axes at (0,0). (If you drew your first graph correctly, it should not start at (0,0).) For this second graph, your data points will not cover most of the page. Draw the best straight line through the data points. extrapolationg the line until it hits the x-axis. This corresponds to y=0 (zero volume). At what temperature does the line cross the x-axis? This is your experimental estimate of "absolute zero". the lowest temperature possible. It corresponds to the temperature at which all molecular motion stops. Additional Questions Why do we use the thermometer markings as volume units in this experiment? Why is it acceptable to use arbitrary volume units in this experiment
Step by Step Solution
There are 3 Steps involved in it

Get step-by-step solutions from verified subject matter experts