

Question: Data in Perspective. Use these data to help answer the following questions: Twenty-Year Trend in Automobile Safety. Use the table to answer the following questions.
Data in Perspective. Use these data to help answer the following questions:
Twenty-Year Trend in Automobile Safety. Use the table to answer the following questions.
a.Express the 1995 and 2015 fatality rates in the deaths per 100 million vehicle-miles traveled.
b.Express the 1995 and 2015 fatality rates in death per 100,000 population.
c.Express the 1995 and 2015 fatality rates in deaths per 100,000 licensed drivers.
d. Are the changes in the three fatality rates from 1995 to 2015 that you found in parts (a)-(c) consist with one another? Briefly comment on the general conclusions they suggest.
Please answer with concise and clear writing. Use proper grammar, and watch spelling please. Do not leave out words. This is from Sacramento City College Math 140. Statistic and Probability. Thank you. Answer A-D in the areas where the questions are please.
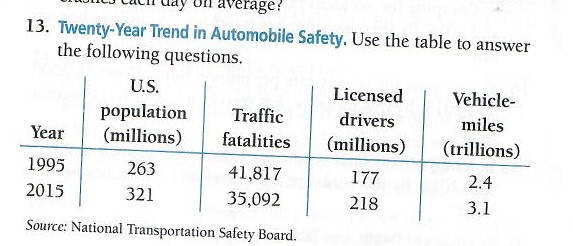
gulf Lay On average! 13. Twenty-Year Trend in Automobile Safety. Use the table to answer the following questions. U.S. Licensed Vehicle- population Traffic drivers miles Year (millions) fatalities (millions) (trillions) 1995 263 41,817 177 2.4 2015 321 35,092 218 3.1 Source: National Transportation Safety Board
Step by Step Solution
There are 3 Steps involved in it

Get step-by-step solutions from verified subject matter experts