

Question: Data in picture *Test at the 5% level for a correlation between percentage spent on health expenditure and the percentage of women receiving prenatal care.
Data in picture *Test at the 5% level for a correlation between percentage spent on health expenditure and the percentage of women receiving prenatal care. Then compute a 95% prediction interval for the percentage of woman receiving prenatal care for a country that spends 5.0% of gdp on on health expenditure. A) null and alternate hypothesis B) level of significance and degree of freedom C)use technology to determine correlation coefficient r between independent variable(percent gdp) and dependent variable (percent women)D) calculate test statistic E) p valueF) compare p value and alpha. What is correct decision to make for hypothesis test G) standard of error
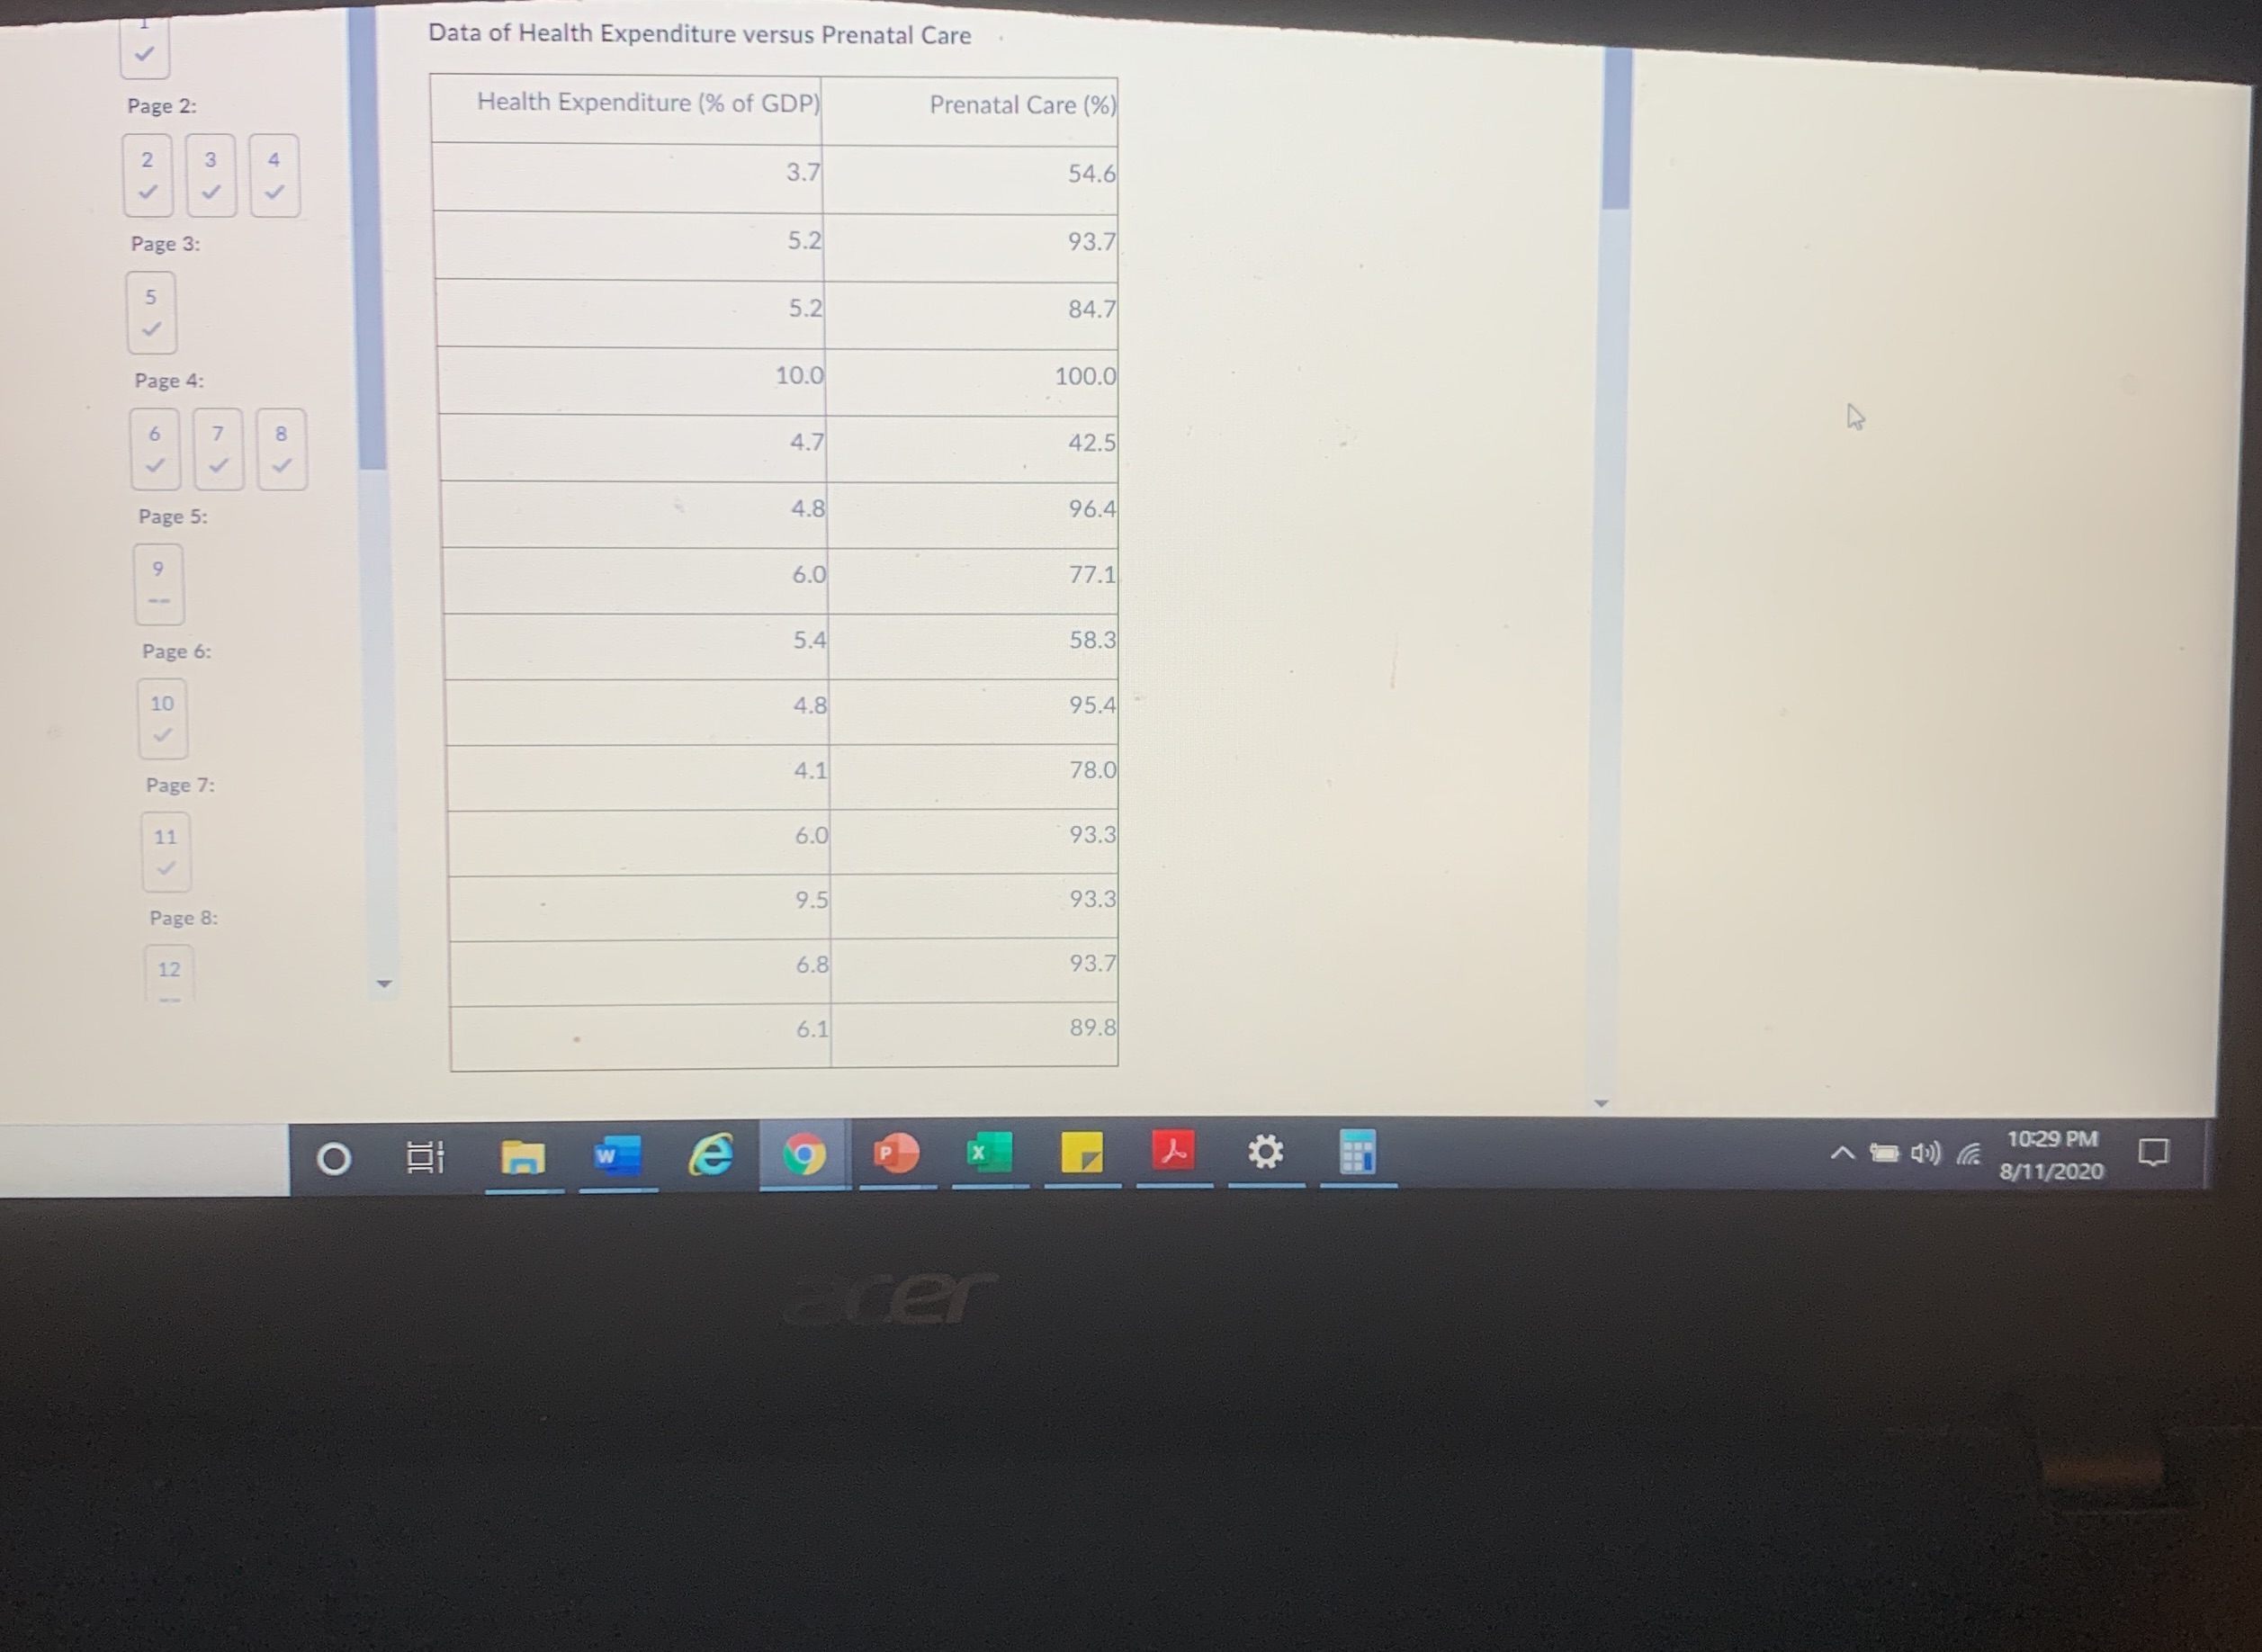
Data of Health Expenditure versus Prenatal Care Page 2: Health Expenditure (% of GDP Prenatal Care (% 3.7 54.6 Page 3: 5.2 93.7 5.2 84.7 Page 4: 10.0 100.0 4.7 42.5 Page 5: 4.8 96.4 19 6.0 77.1 Page 6: 5.4 58.3 10 V 4.8 95.4 Page 7: 4.1 78.0 11 6.0 93.3 Page 8: 9.5 93.3 12 6.8 93.7 6.1 89.8 O m w e 9 P X 10:29 PM 8/11/2020 ater
Step by Step Solution
There are 3 Steps involved in it

Get step-by-step solutions from verified subject matter experts