

Question: Data Interpretation and Analysis World Population Versus Time 25. The graph displays world population over time. Study the graph and answer the following questions. (a)
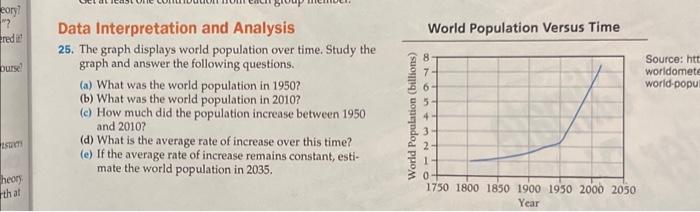
Data Interpretation and Analysis World Population Versus Time 25. The graph displays world population over time. Study the graph and answer the following questions. (a) What was the world population in 1950? (b) What was the world population in 2010? (c) How much did the population increase between 1950 and 2010? (d) What is the average rate of increase over this time? (e) If the average rate of increase remains constant, estimate the world population in 2035
Step by Step Solution
There are 3 Steps involved in it
1 Expert Approved Answer
Step: 1 Unlock

Question Has Been Solved by an Expert!
Get step-by-step solutions from verified subject matter experts
Step: 2 Unlock
Step: 3 Unlock