

Question: DATA IS ON SECOND PICTURE******** A Prepare and interpret a performance report (Learning Objective 2 P1 Performance Evaluation 639 Refer to the Outrageous Bubbles data
DATA IS ON SECOND PICTURE********
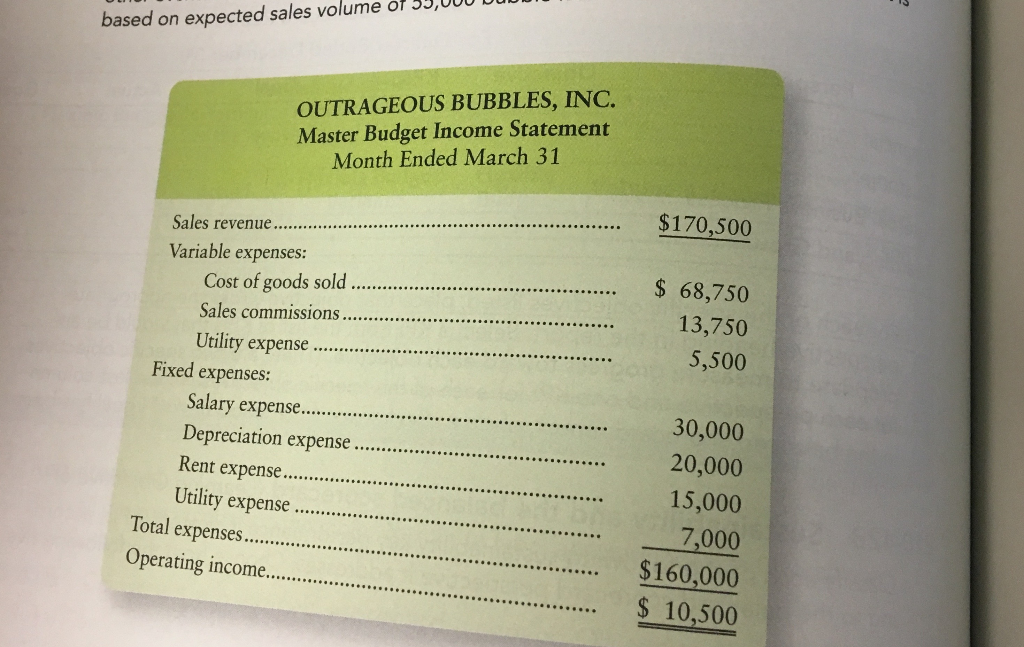
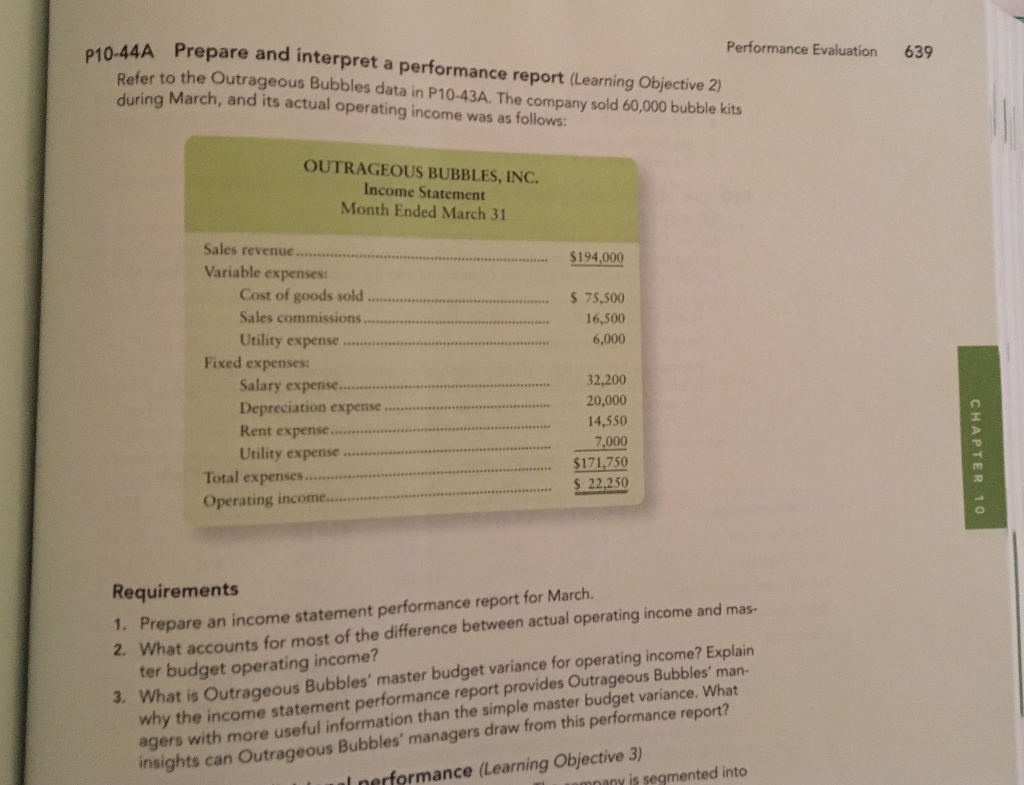
A Prepare and interpret a performance report (Learning Objective 2 P1 Performance Evaluation 639 Refer to the Outrageous Bubbles data in P10-43A. The company sold 60,000 bubble kits during March, and its actual operating income was as follows OUTRAGEOUS BUBBLES, INC. Income Statement Month Ended March 31 Sales revenue Variable expenses: $194,000 Cost of goods sold.... Sales commissions Utility expense s 75,500 16,500 6,000 Fixed expenses: Salary expense Depreciation expense. Rent expense Utility expense 32,200 20,000 14,550 7,000 $171750 S 22,250 Total expenses Operating income.... Requirements 1. Prepare an income statement performance report for March. 2. What accounts for most of the difference between actual operating income and mas- ter budget operating income? What is Outrageous Bubbles' master budget variance for operating income? Explain why the income statement performance report provides Outrageous Bubbles' man- agers with more useful information than the simple master budget variance. What insights can Outrageous Bubbles' managers draw from this performance report? 3. I nerformance (Learning Objective 3) nany is segmented into based on expected sales volume of 33,000 DU OUTRAGEOUS BUBBLES, INC. Master Budget Income Statement Month Ended March 31 $170,500 Sales revenue.. Variable expenses: $ 68,750 13,750 5,500 Cost of goods sold Sales commissions... . Utility expense Fixed expenses: Salary expense 30,000 20,000 15,000 7,000 $160,000 10,500 Depreciation expense .. Utility expense Total expenses. Operating income.. A Prepare and interpret a performance report (Learning Objective 2 P1 Performance Evaluation 639 Refer to the Outrageous Bubbles data in P10-43A. The company sold 60,000 bubble kits during March, and its actual operating income was as follows OUTRAGEOUS BUBBLES, INC. Income Statement Month Ended March 31 Sales revenue Variable expenses: $194,000 Cost of goods sold.... Sales commissions Utility expense s 75,500 16,500 6,000 Fixed expenses: Salary expense Depreciation expense. Rent expense Utility expense 32,200 20,000 14,550 7,000 $171750 S 22,250 Total expenses Operating income.... Requirements 1. Prepare an income statement performance report for March. 2. What accounts for most of the difference between actual operating income and mas- ter budget operating income? What is Outrageous Bubbles' master budget variance for operating income? Explain why the income statement performance report provides Outrageous Bubbles' man- agers with more useful information than the simple master budget variance. What insights can Outrageous Bubbles' managers draw from this performance report? 3. I nerformance (Learning Objective 3) nany is segmented into based on expected sales volume of 33,000 DU OUTRAGEOUS BUBBLES, INC. Master Budget Income Statement Month Ended March 31 $170,500 Sales revenue.. Variable expenses: $ 68,750 13,750 5,500 Cost of goods sold Sales commissions... . Utility expense Fixed expenses: Salary expense 30,000 20,000 15,000 7,000 $160,000 10,500 Depreciation expense .. Utility expense Total expenses. Operating income
Step by Step Solution
There are 3 Steps involved in it

Get step-by-step solutions from verified subject matter experts